
Setting up Open Source Observability Stack on Kubernetes from scratch

TL;DR — In this post we will use the Grafana Open source Stack, using Prometheus, Loki, Tempo as datasources to obtain metrics, logs and traces respectively. We will also correlate the trace_id with Java metrics using Exemplars and we will instrument a Spring Boot application with Opentelemetry. All this deployed on a Kubernetes cluster.
If you are an advanced user and want to test it directly, just check the README.md -> Github
Resources:
I always follow closely new open source tools and especially if it is about observability tools, I consider that the world of observability is very broad, complex and every time new interesting tools come out. Now, I present you some tools that have caught my attention. Before starting a brief introduction about the tools.
OpenTelemetry: It helps us to collect metrics, logs and traces using an agent; then it can send them to other tools. It has a lot of instrumentation power and integration with several programming languages. It is in incubation within the CNCF.
Prometheus: One of the largest and best known tools in the world of metric collection, it is graduated at the CNCF.
Exemplars: Tool that correlates the trace_id with metrics on the backend side. It is interesting because through resource metrics you can get traces and get to the log. It works hand in hand with Prometheus.
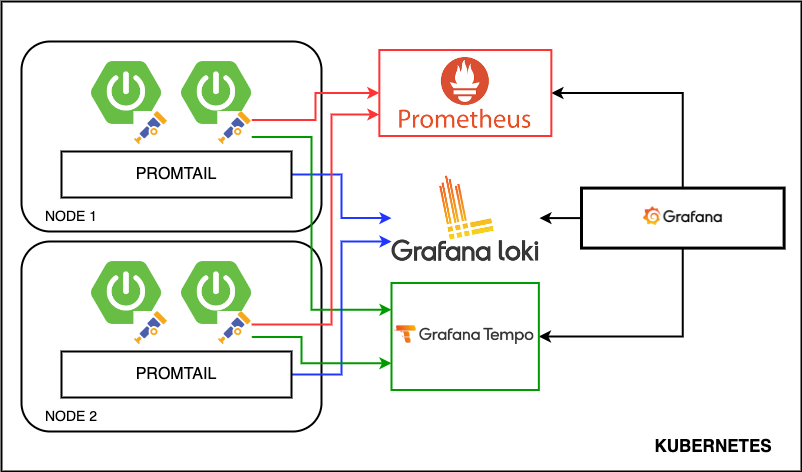
Promtail: Tool that sends the logs to Loki, just as Prometheus collects logs and works as an agent in each node of the cluster.
Loki: Tool that receives logs, centralizes them, distributes them, ingests, allows applying rules and has its own syntax to perform queries (LogQL). It has very good integration with Kubernetes.
Tempo: Tool that receives OpenTelemetry traces to be able to visualize them with an embedded interface (Jaeger). It has an intuitive visualization and integrates with Loki and exemplars.
Grafana: Interface that allows to integrate multiple datasources, dashboards, alerts and many other visualization tools.
Setting up a Backend Application
For this demo we will use Java - Spring Boot, since it is very common to see microservices projects with this framework.
The first thing we need is to create a Java Spring boot project, we will use https://start.spring.io/ . It helps you to quickly generate a Java project using Spring Boot, it also allows you to add the dependencies you will use and other configurations to the project.
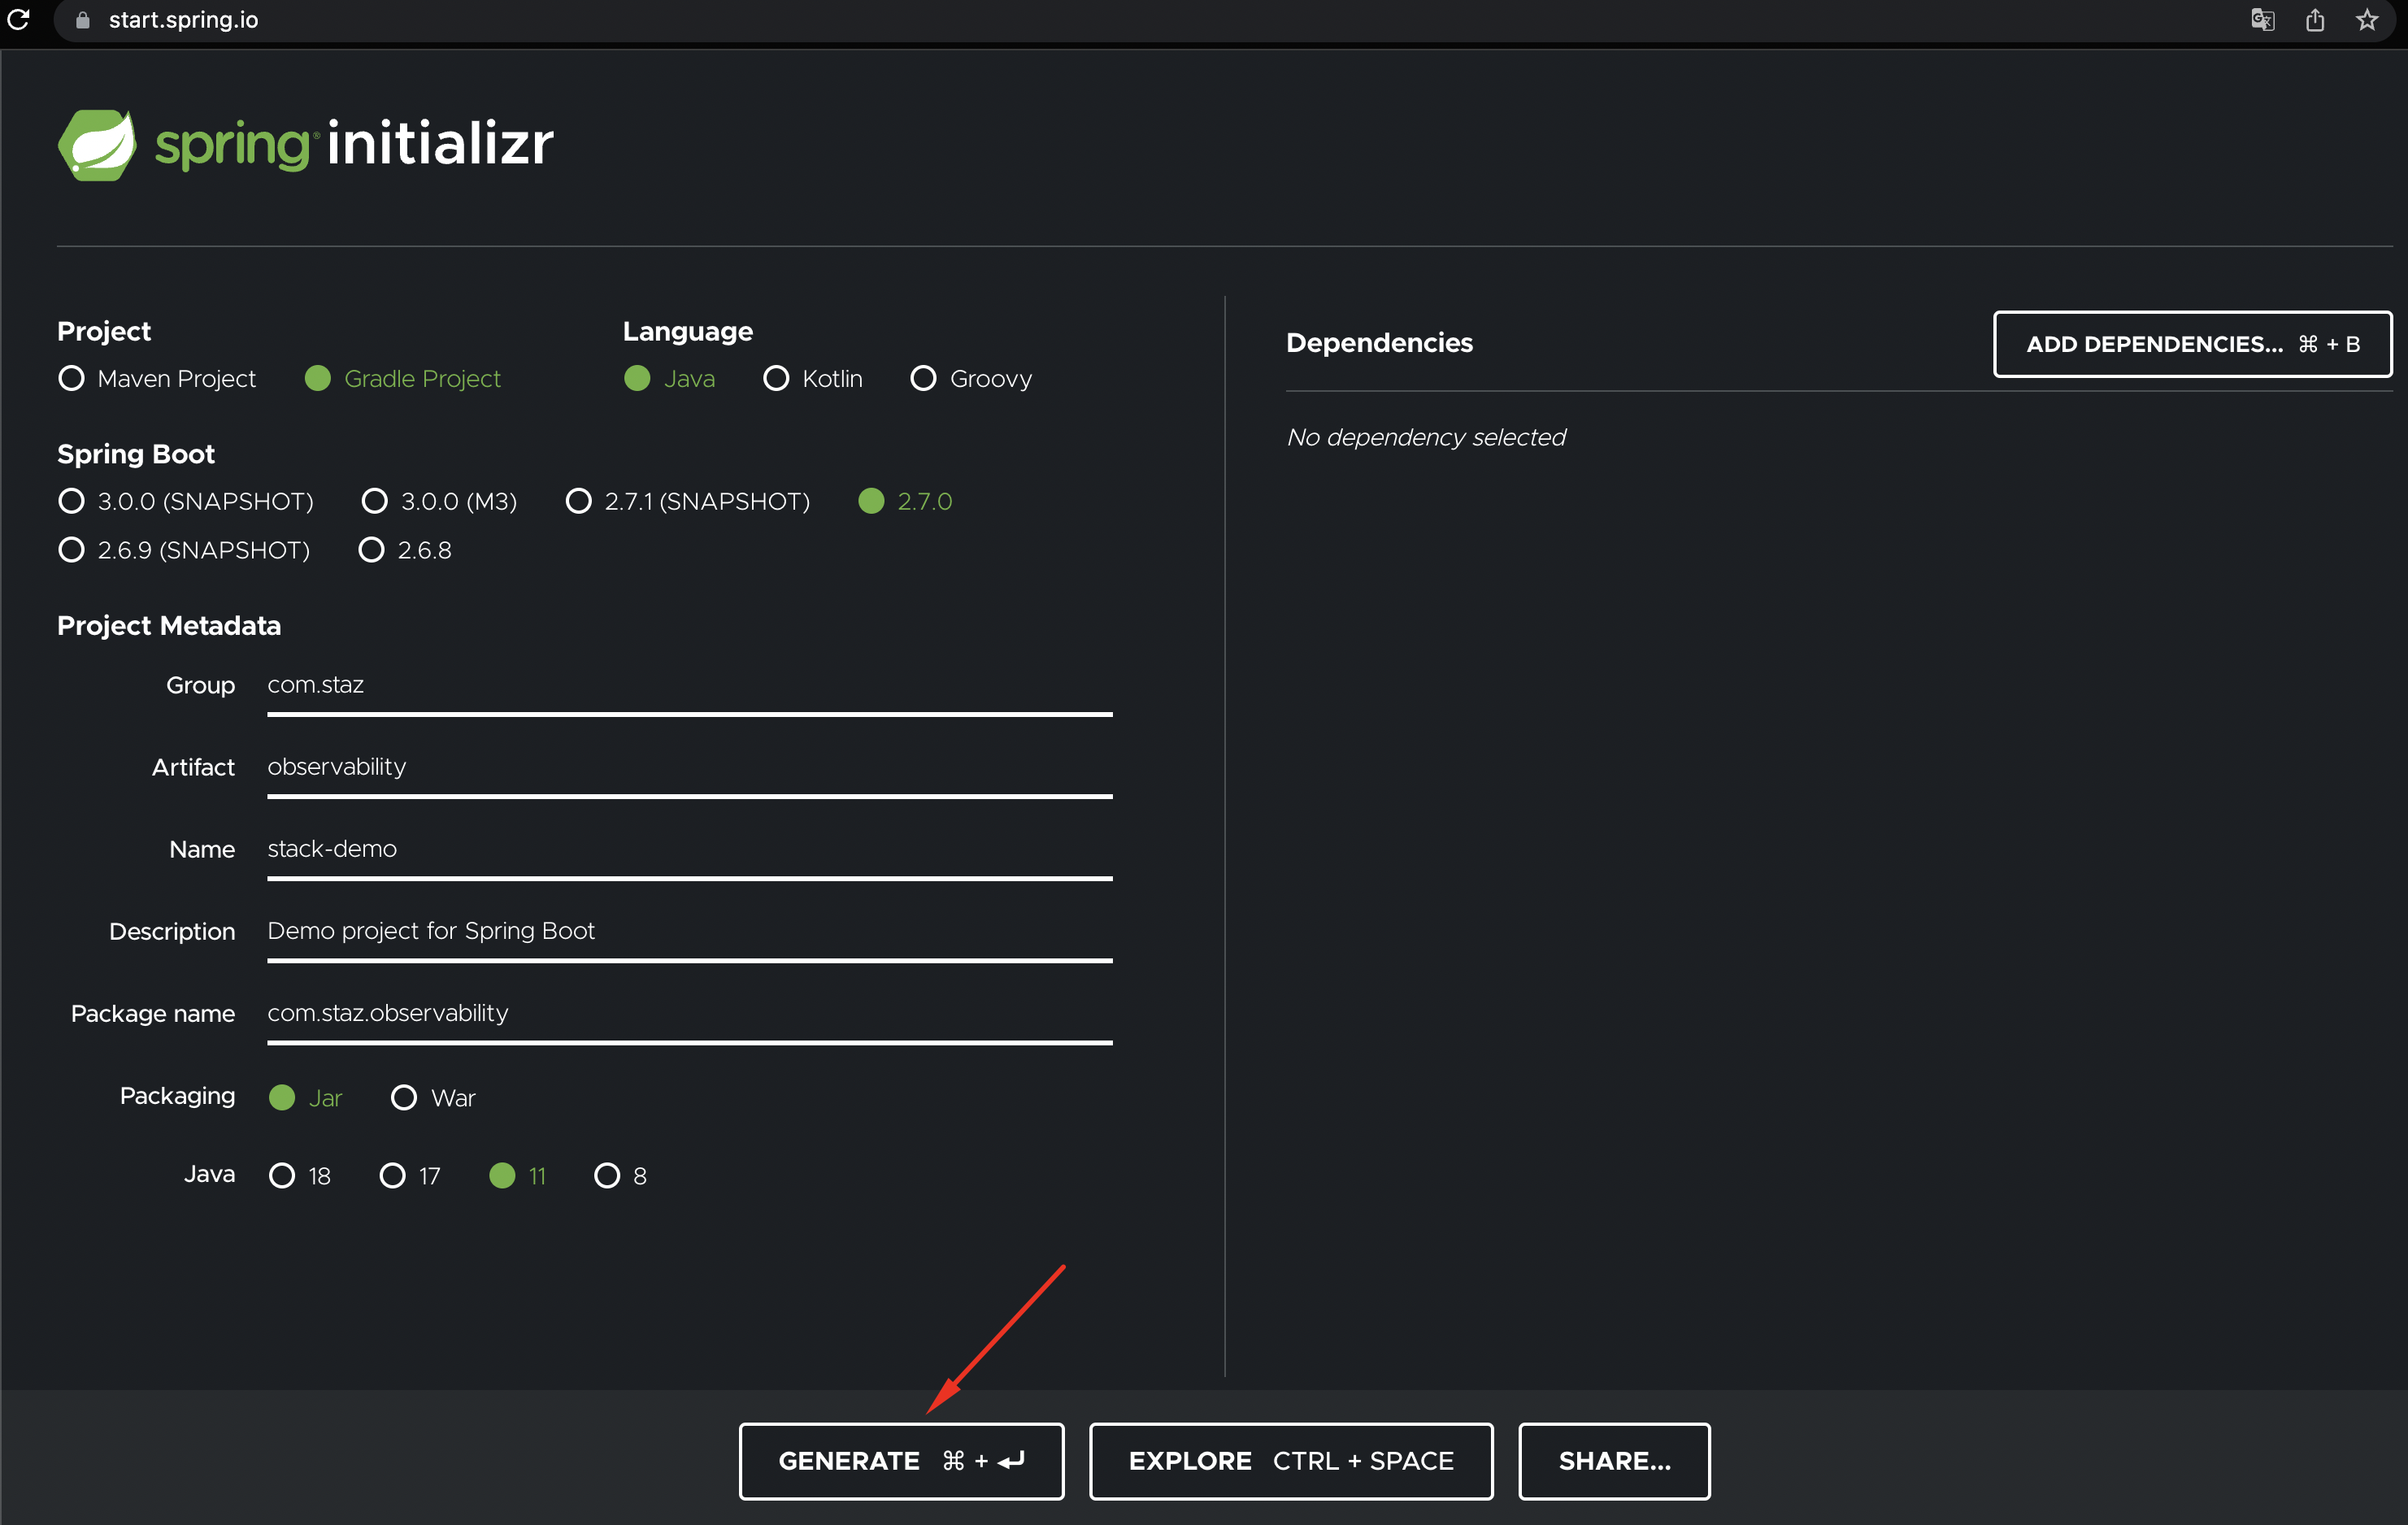
Make sure to configure it as shown in the screenshot. In this case I will use Gradle as build automation tool, Spring Boot in version 2.7, JAR as package build format and JDK11.
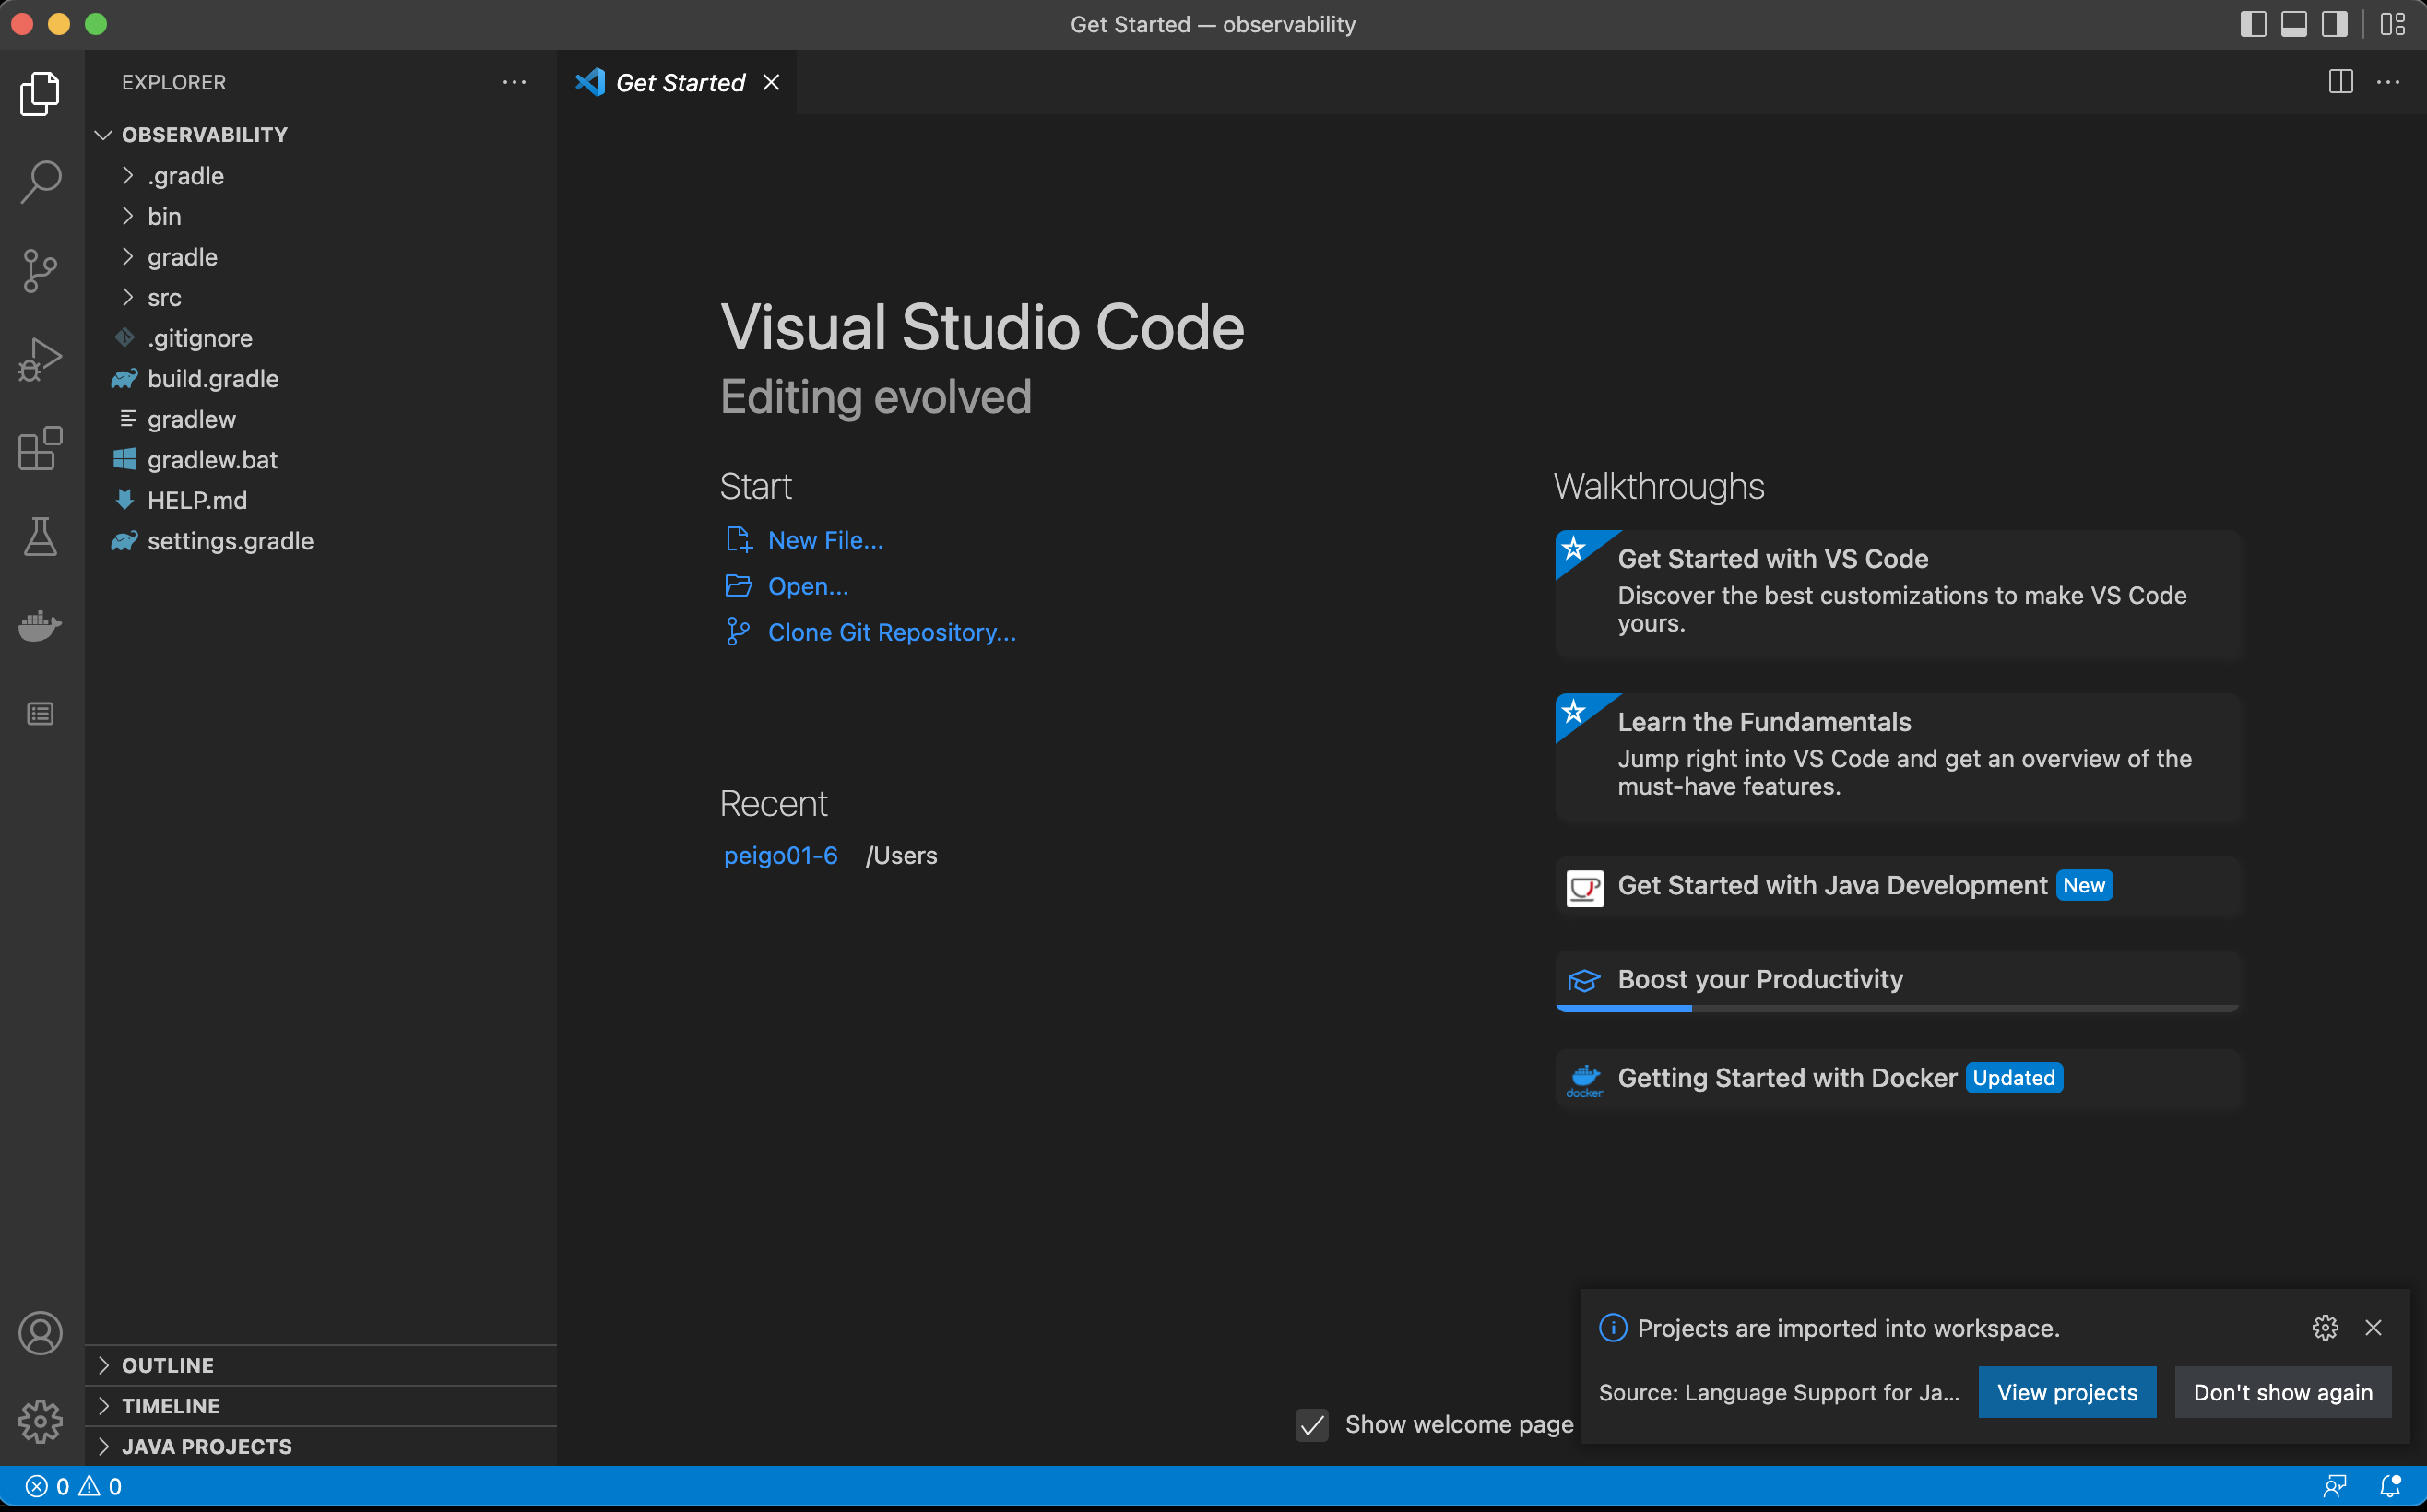
When you finish the configuration click on Generate; you can download, unzip and import it into your favorite IDE (I will use Visual Studio Code, you can download it here).
We will set up our build.gradle in the root of the project, make sure you have all the dependencies:
plugins {
    id 'org.springframework.boot' version '2.7.0'
    id 'io.spring.dependency-management' version '1.0.11.RELEASE'
    id 'java'
}

repositories {
  maven {
    url = uri('https://repo.spring.io/libs-snapshot')
  }
    mavenCentral()
}

dependencyManagement {
  imports {
    mavenBom 'io.micrometer:micrometer-bom:1.9.0-SNAPSHOT'
  }
}

dependencies {
  implementation 'org.springframework.boot:spring-boot-starter-actuator'
  implementation 'io.micrometer:micrometer-registry-prometheus:1.9.0'
  implementation 'org.springframework.boot:spring-boot-starter-web'
  implementation 'io.opentelemetry:opentelemetry-api:1.12.0'
}

tasks.named('test') {
    useJUnitPlatform()
}

group = 'com.staz'
version = '0.0.1-SNAPSHOT'
sourceCompatibility = '11'
Then we will create a Controller Class Controller.java with 2 endpoints: /fail and success. The file must be located in the path ${project}/src/main/java/com/staz/observability/ in my case.
package com.staz.observability;

import org.springframework.web.bind.annotation.GetMapping;
import org.springframework.web.bind.annotation.PostMapping;
import org.springframework.web.bind.annotation.RestController;

@RestController
public class Controller {

    @PostMapping("/fail")
    public String fail() {
        return "Fail!";
    }

    @GetMapping("/success")
    public String success() {

        return "Success!";
    }

}
In order to correlate the Java metrics sent through prometheus with the trace_id generated by OpenTelemetry (using Exemplar), we will need to add a Configuration Class that will apply for the whole project PrometheusExemplarConfiguration.java in the same path as the previous ${project}/src/main/java/com/staz/observability/:
package com.staz.observability;

import io.micrometer.core.instrument.Clock;
import io.micrometer.prometheus.PrometheusConfig;
import io.micrometer.prometheus.PrometheusMeterRegistry;
import io.opentelemetry.api.trace.Span;
import io.prometheus.client.CollectorRegistry;
import io.prometheus.client.exemplars.DefaultExemplarSampler;
import io.prometheus.client.exemplars.tracer.otel_agent.
       OpenTelemetryAgentSpanContextSupplier;
import org.springframework.context.annotation.Bean;
import org.springframework.context.annotation.Configuration;

@Configuration
public class PrometheusExemplarConfiguration {
    @Bean
    public PrometheusMeterRegistry prometheusMeterRegistryWithExemplar
    (PrometheusConfig prometheusConfig, CollectorRegistry collectorRegistry,
    Clock clock) {
        return new PrometheusMeterRegistry(prometheusConfig, collectorRegistry,
        clock, new DefaultExemplarSampler(new OpenTelemetryAgentSpanContextSupplier() {

                    @Override
                    public String getTraceId() {
                        if (!Span.current().getSpanContext().isSampled()) {
                            return null;
                        }
                        return super.getTraceId();
                    }
                })
        );
    }
}
Now, set the properties file application.yml -> ${project}/src/main/resources/ :
# Enable Actuator endpoints including Prometheus
management:
  endpoints:
    web:
      exposure:
        include: health, info, prometheus
  metrics:
    # Exemplar metrics
    distribution:
      percentiles-histogram:
        http.server.requests: true
      minimum-expected-value:
        http.server.requests: 5ms
      maximum-expected-value:
        http.server.requests: 1000ms

# Add trace_id in log. OpenTelemetry set this value using logger-mdc.
# https://github.com/open-telemetry/opentelemetry-java-instrumentation/blob/main/docs/logger-mdc-instrumentation.md
logging:
  pattern:
    level: '%prefix(%mdc{trace_id:-0}) %5p'
In order to run it in our local environment we will need the OpenTelemetry Agent, for this demo I am using version 1.12.1. You can download it here.
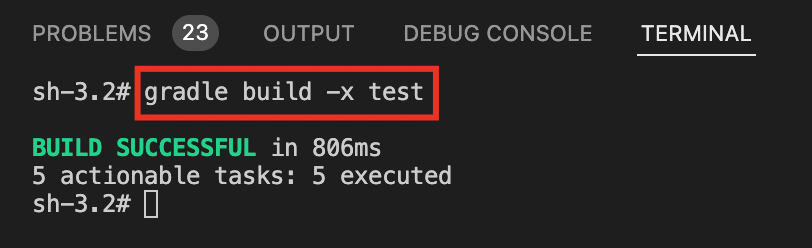
Done, now in the terminal, from the root path of our project run:
$ gradle build -x test
Then to start Spring Boot with the Opentelemetry Agent, our project pointing to application.yml, run:
$ java -javaagent:opentelemetry-javaagent.jar -Dspring.config.location=src/main/resources/application.yml -jar build/libs/observability-0.0.1-SNAPSHOT.jar
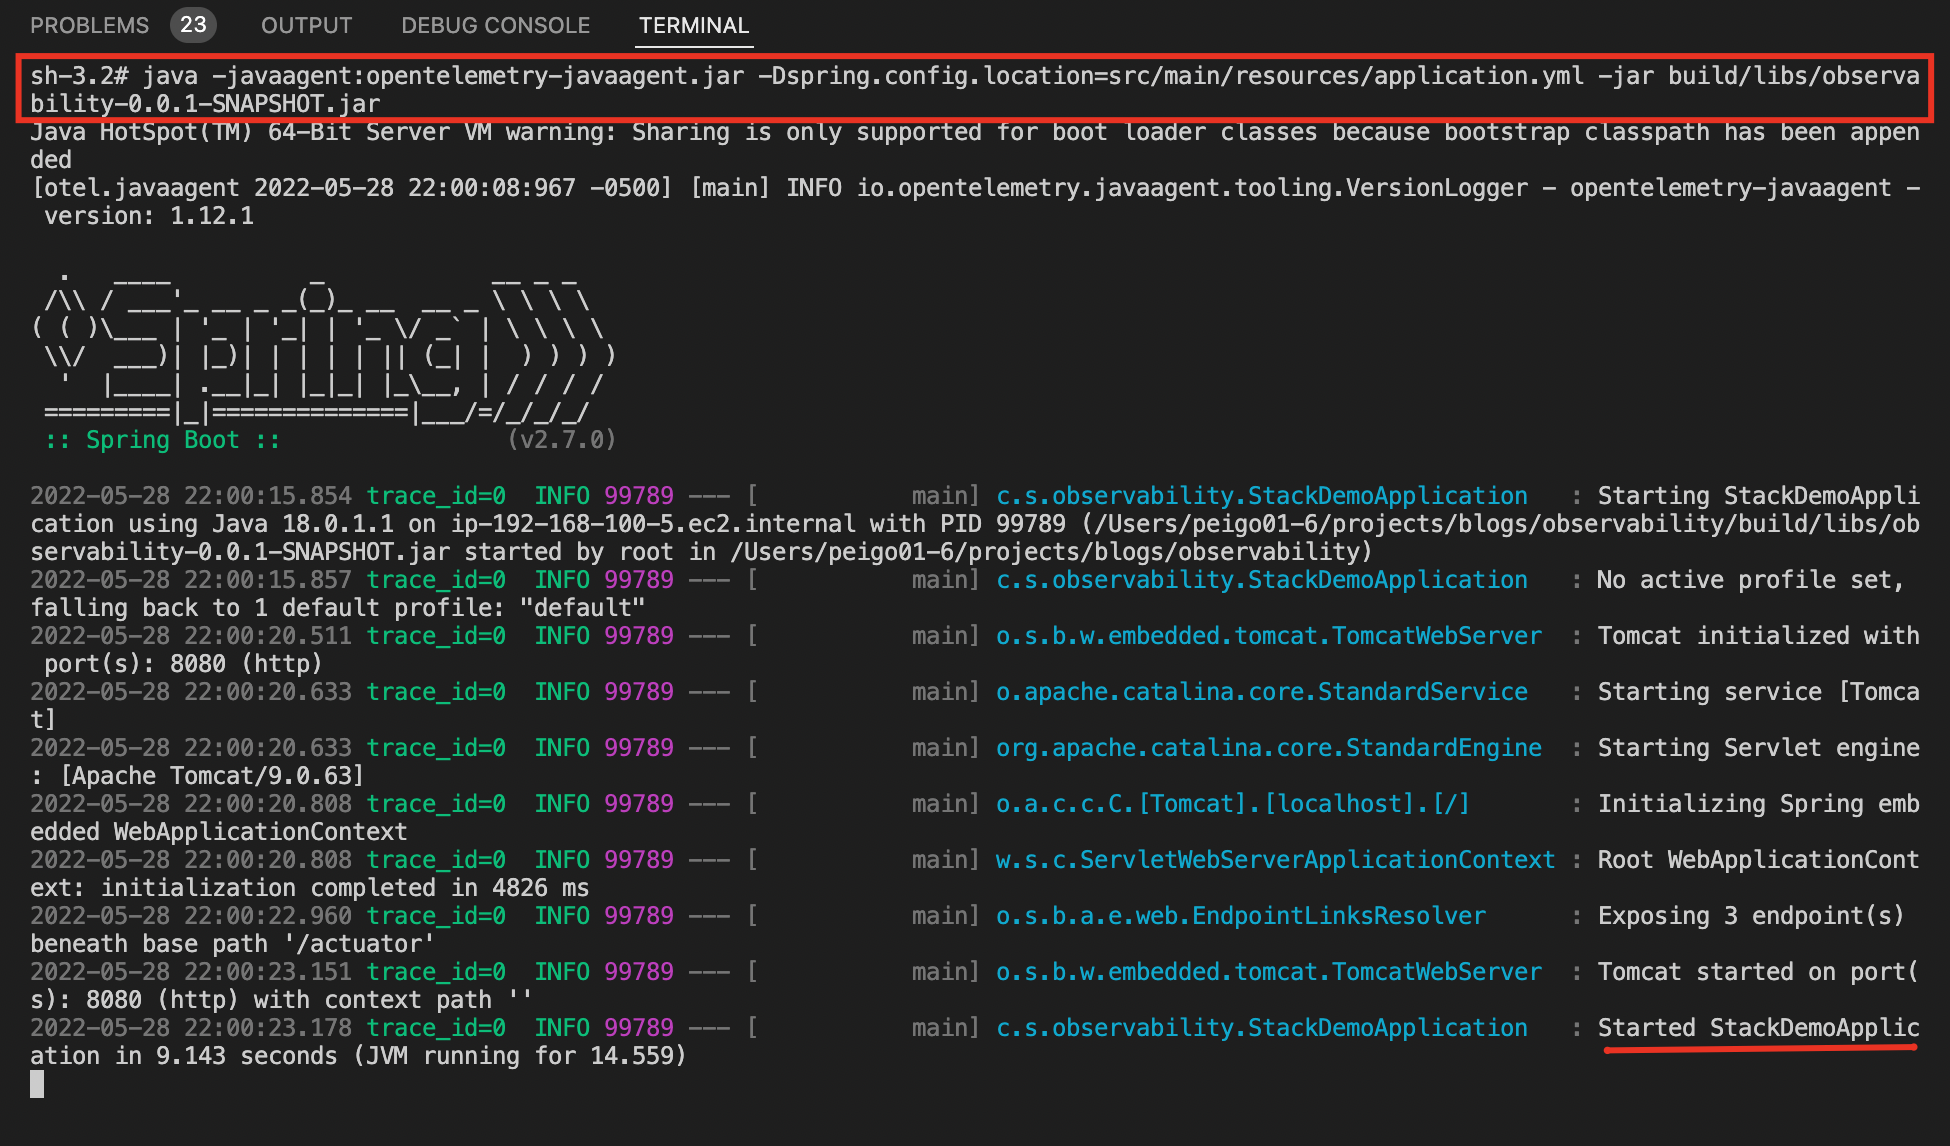
Our application has been deployed on the default port for Spring Boot which is 8080. We will test our 2 endpoints htttp://localhost:8080/fail and htttp://localhost:8080/success.
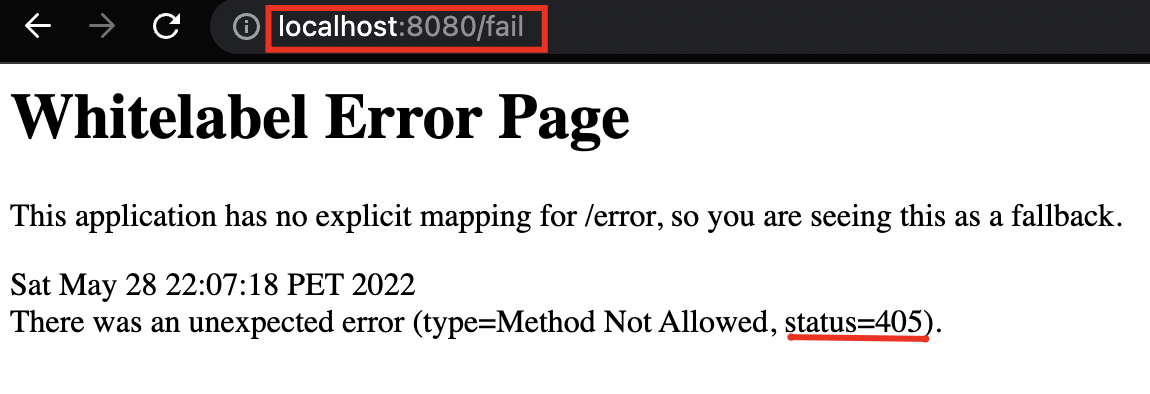
For the first one the result should be a 405 Method Not Allowed error and for the second one it should show the message Success! with status code 200, this is how the result should look like:
Testing /fail endpoint:
Testing /success endpoint:
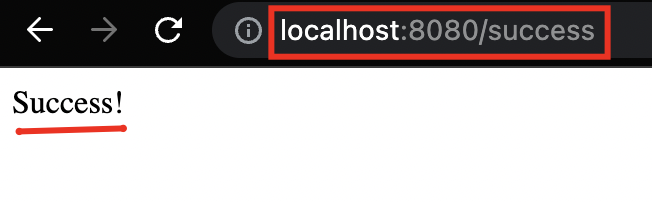
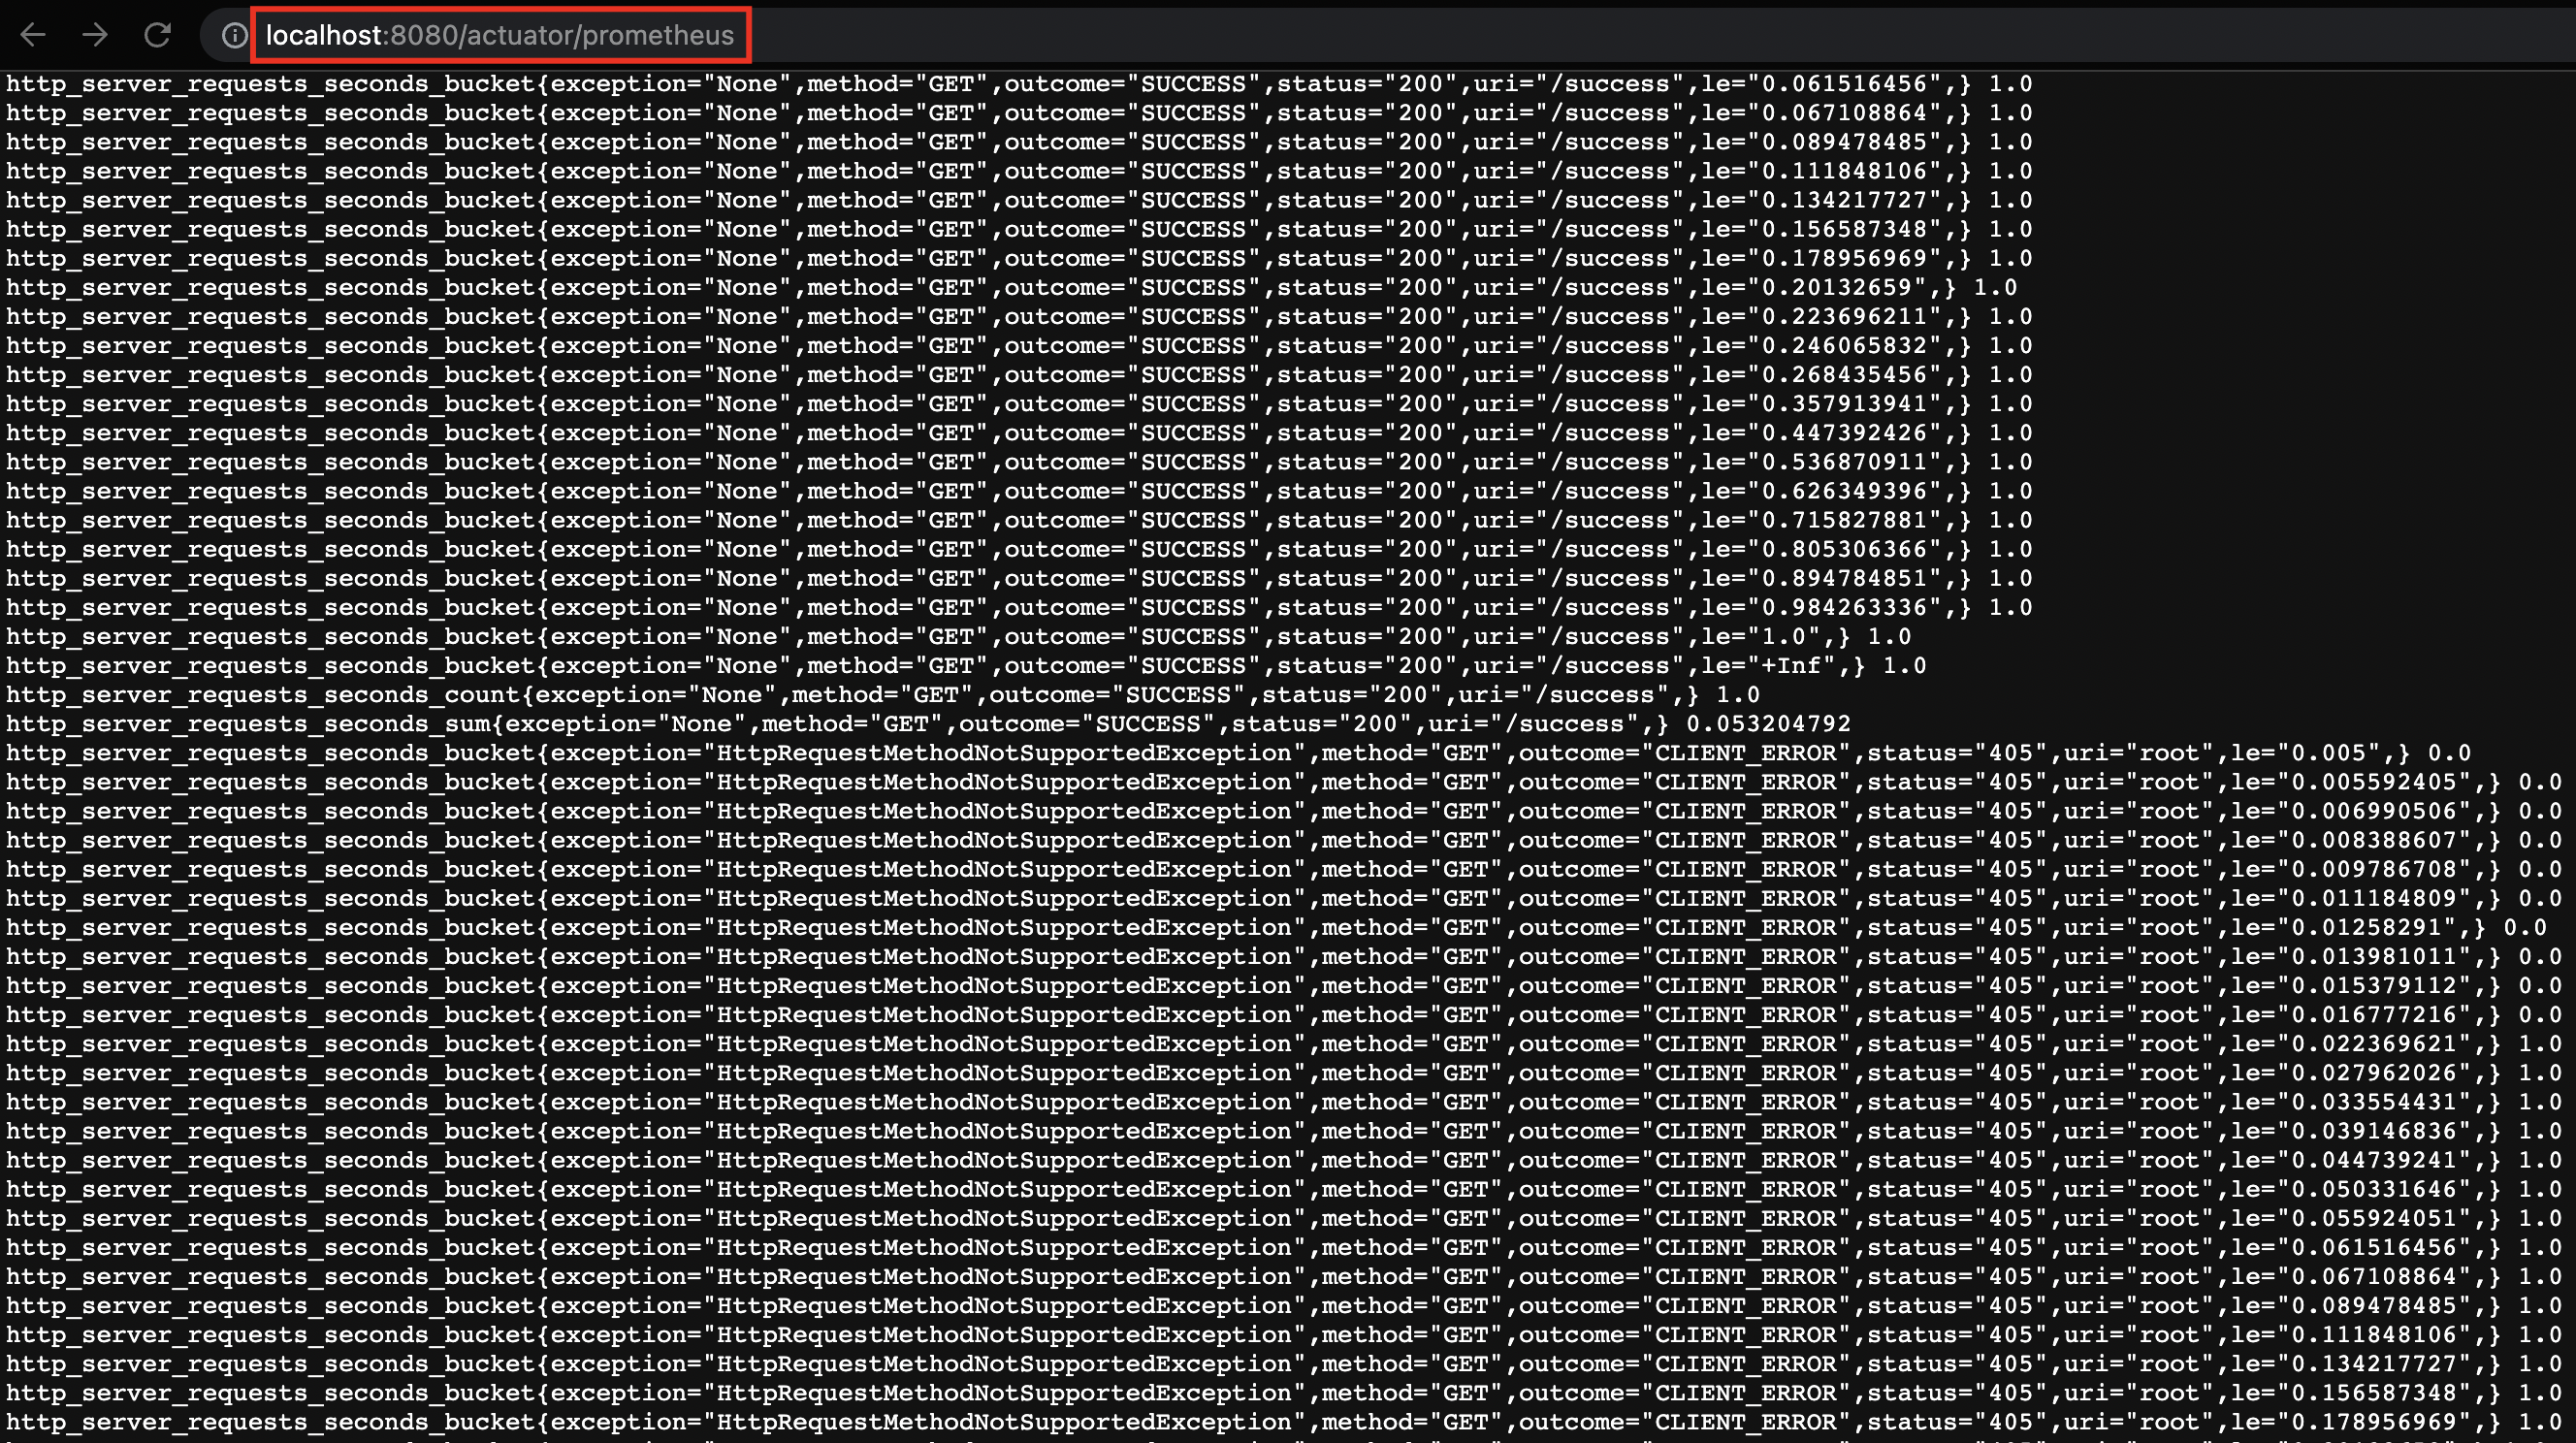
After having tested our endpoints we are going to see our Prometheus metrics, we will go to our actuator endpoint: http://localhost:8080/actuator/prometheus and look for the metrics we are interested in http_server_requests_seconds_count, http_server_requests_seconds_sum and http_server_requests_seconds_bucket.
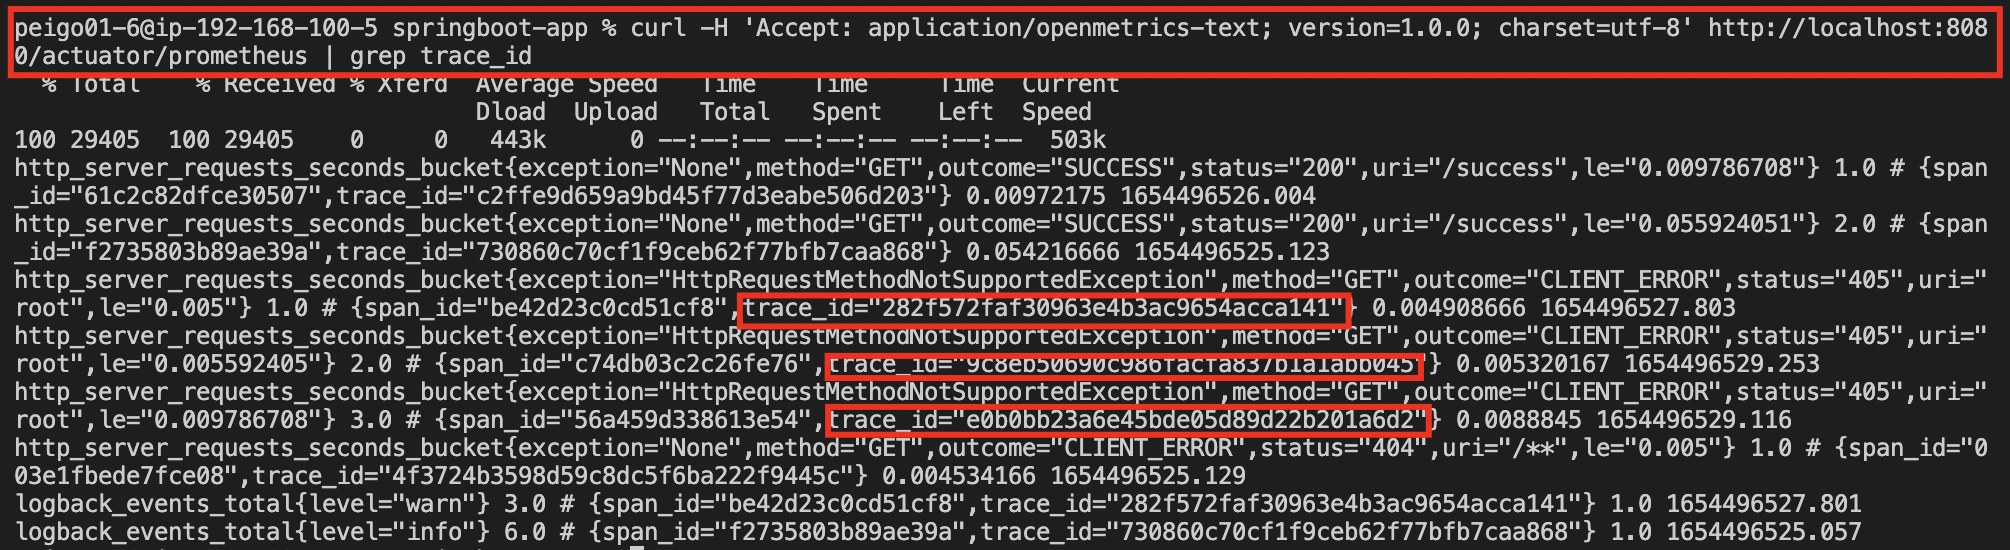
To make sure Exemplar is correlating lod trace_id we will run a curl with the OpenMetrics header:
$ curl -H 'Accept: application/openmetrics-text; version=1.0.0; charset=utf-8' http://localhost:8080/actuator/prometheus | grep trace_id
We have our Spring Boot application ready, now we need to install the observability tools. Before that, we are going to install it on Kubernetes
k3slocally, usingMultipasswe will create an ubuntu node andHelmto deploy our tools inside our single-node cluster.
Containerizing our Spring Boot project
Before creating our local cluster, let's create the Dockerfile for our Spring Boot Application, in the root of our project. If you don't have Docker installed, you can download it here.
# Download OpenTelemetryAgent
FROM curlimages/curl:7.81.0 AS OTEL_AGENT
ARG OTEL_AGENT_VERSION="1.12.1"
RUN curl --silent --fail -L "https://github.com/open-telemetry/opentelemetry-java-instrumentation/releases/download/v${OTEL_AGENT_VERSION}/opentelemetry-javaagent.jar" \
    -o "/tmp/opentelemetry-javaagent.jar"

# Build .JAR file
FROM gradle:7.1.1-jdk11-hotspot AS BUILD_IMAGE
COPY --chown=gradle:gradle . /home/gradle/src
WORKDIR /home/gradle/src
RUN gradle build -x test --no-daemon

# Final image copying OTEL Agent and .JAR File
FROM gradle:7.1.1-jdk11-hotspot
ENV TIME_ZONE America/Lima
ENV TZ=$TIME_ZONE
ENV JAVA_OPTS "-Dspring.config.location=src/main/resources/application.yml"
COPY --from=OTEL_AGENT /tmp/opentelemetry-javaagent.jar /otel-javaagent.jar
COPY --from=BUILD_IMAGE home/gradle/src/build/libs/*.jar app.jar
ENTRYPOINT exec java -javaagent:/otel-javaagent.jar -jar app.jar
To test it we must build it and run it for it, run:
$ docker build --no-cache -t otel-springboot-prometheus .
$ docker run -it -p 8080:8080 otel-springboot-prometheus
After running them, you should be able to see the Spring Boot logs with the container started. Then in the browser you could go to http://localhost:8080/success and you should have the same result as before.
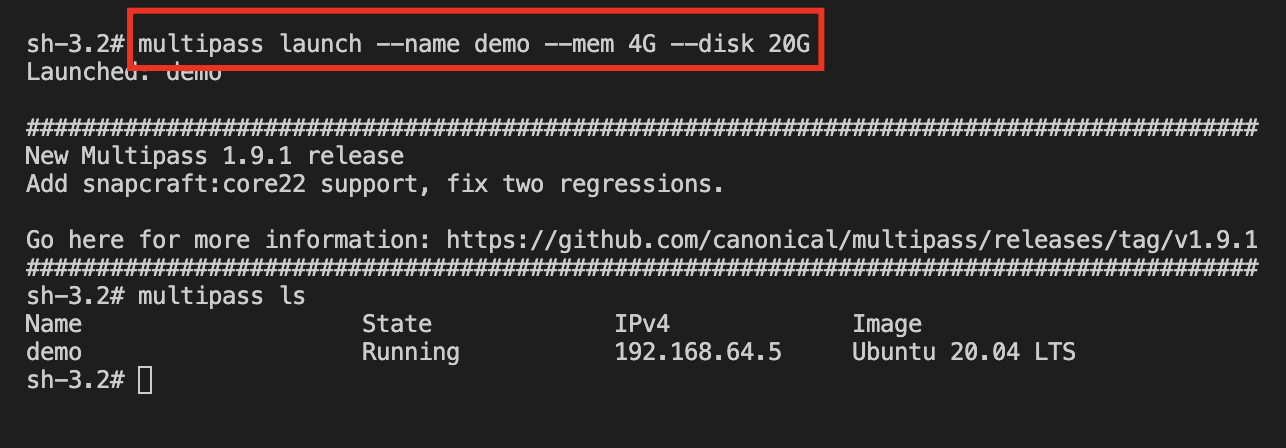
- Creating our local single-node cluster
To install an Ubuntu instance we will use Multipass. After installing it, we will create an Ubuntu instance passing as parameters node name, ram and disk that we will assign (minimum 4G of Ram and 10Gb Disk).
Go to the terminal and run:
$ multipass launch --name demo --mem 4G --disk 20G
We will log in our already created instance:
$ multipass shell demo
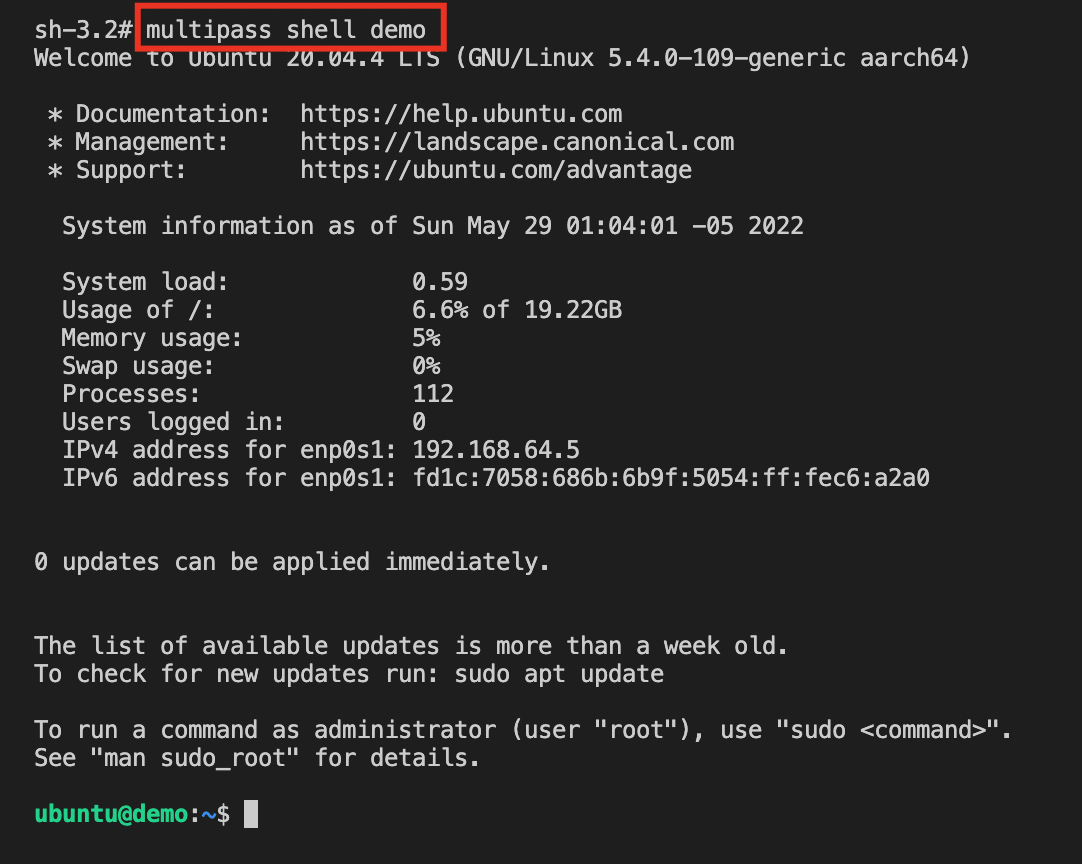
Verify that we are inside the instance and we will scale to root:
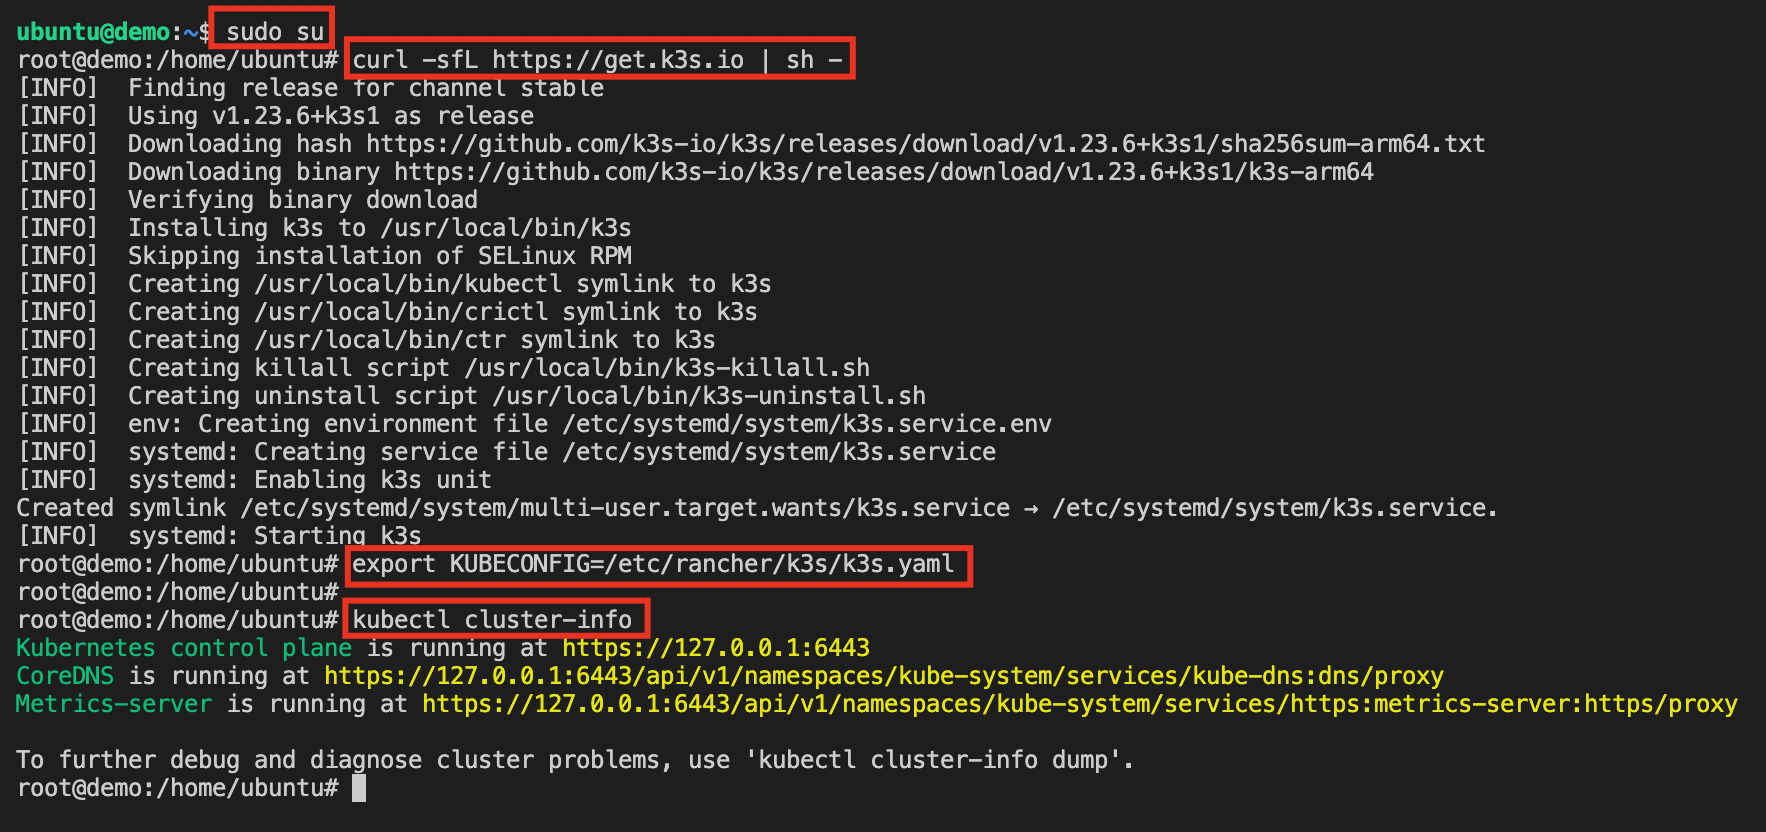
$ sudo su
Install k3s:
$ curl -sfL https://get.k3s.io | sh -
Add KUBECONFIG environment variable:
$ export KUBECONFIG=/etc/rancher/k3s/k3s.yaml
Verify that we have kubernetes installed:
$ kubectl cluster-info
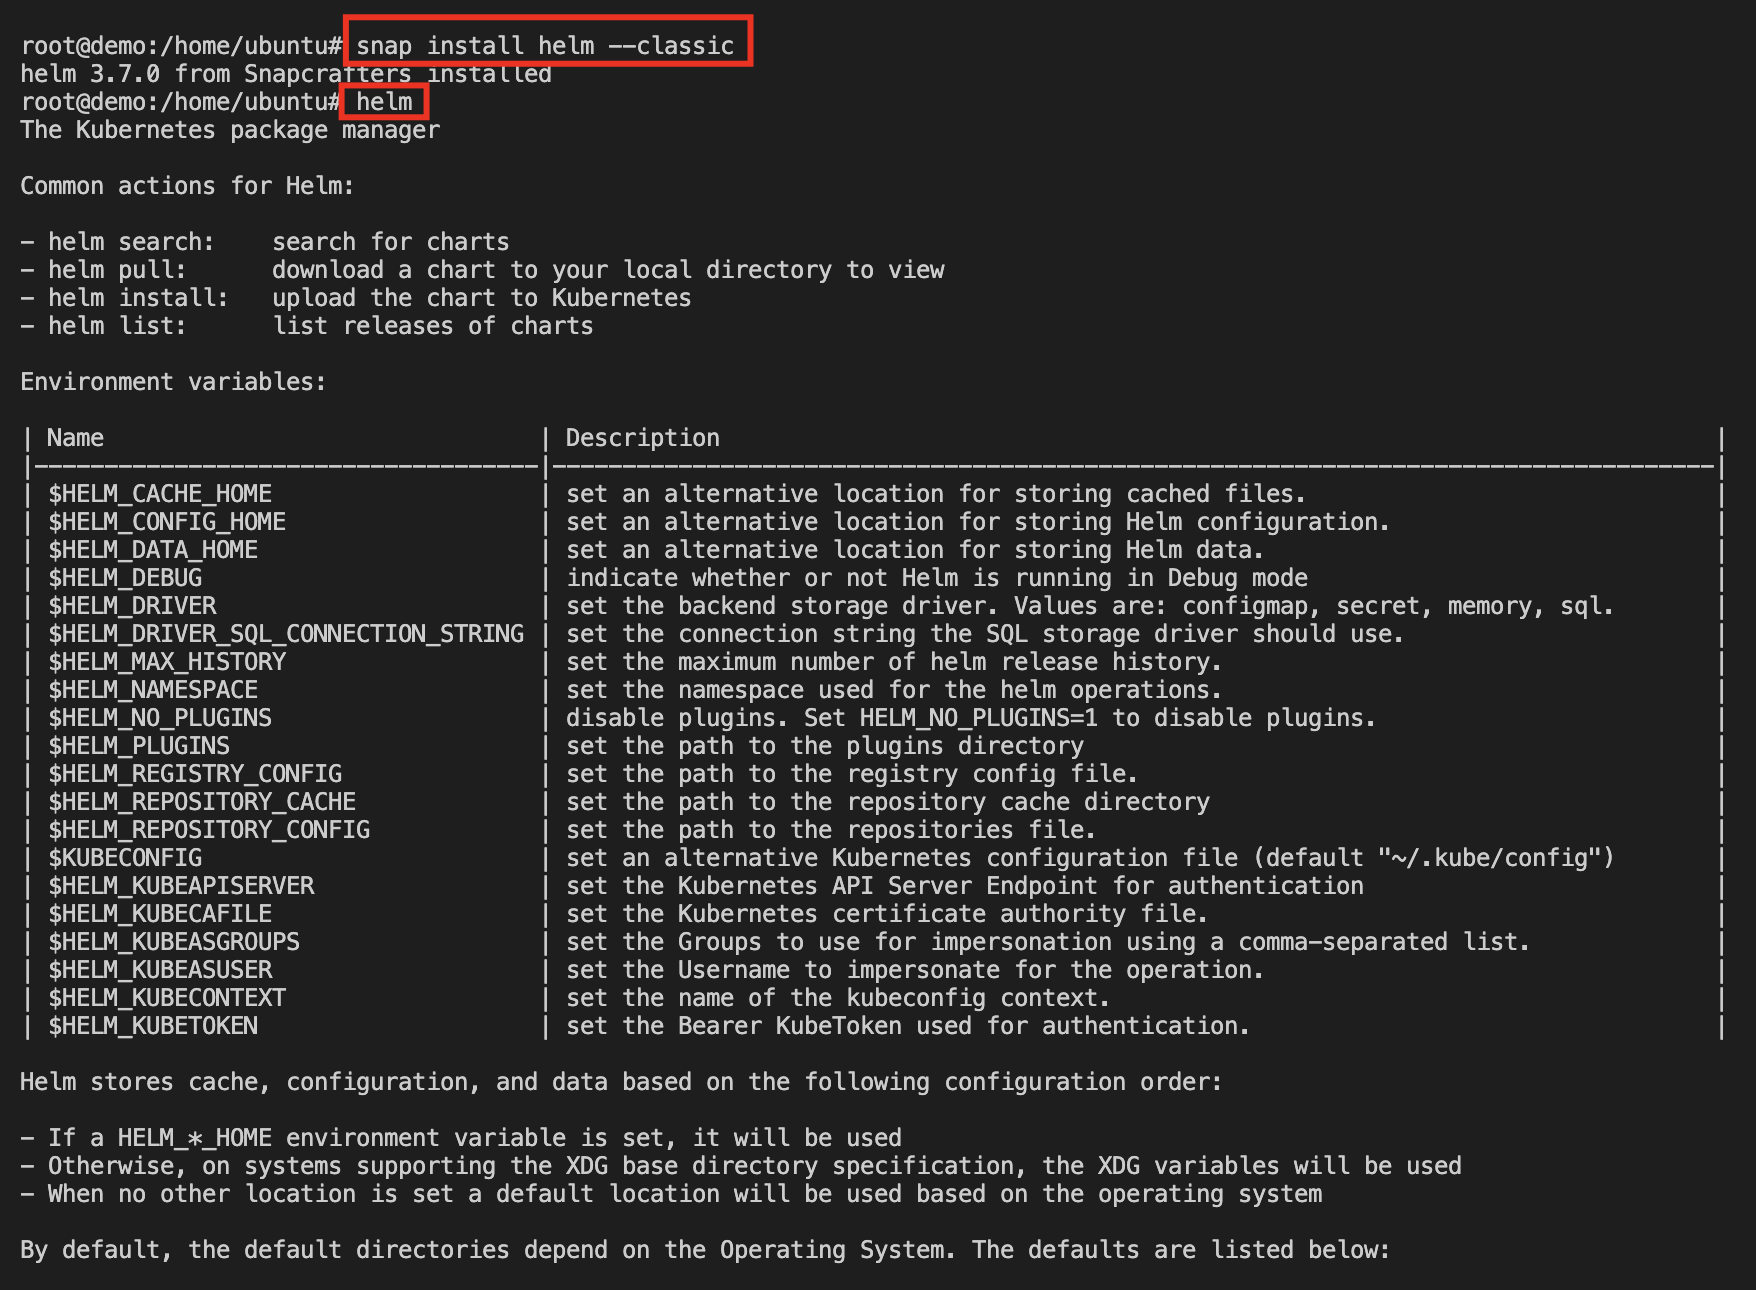
Install Helm:
$ snap install helm --classic
Copy k3 KUBECONFIG in the ~/.kube/config directory:
$ kubectl config view --raw > ~/.kube/config
Verify that we have Helm installed:
$ helm
Deploying our Observability Stack
Now we are ready to deploy our Helm charts that install Prometheus, Promtail, Loki, Tempo and Grafana. We will also finally deploy our Spring Boot application.
All the following steps are done inside the demo node that we created before:
$ multipass shell demo
$ sudo su
Clone the repository to have the manifests at hand:
$ git clone https://github.com/stazdx/otel-springboot-grafana-tools.git
$ cd otel-springboot-grafana-tools/kubernetes
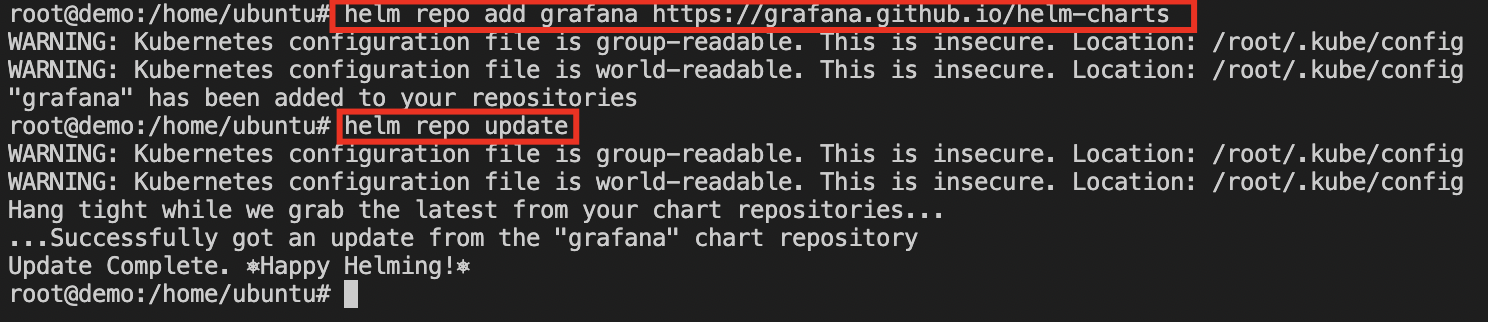
We will add the charts we will need for the tools and update the Helm repository:
$ helm repo add grafana https://grafana.github.io/helm-charts
$ helm repo update
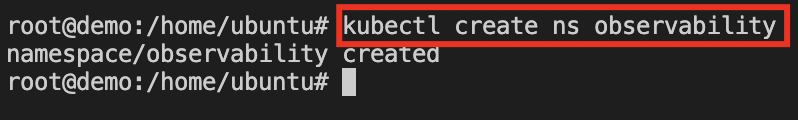
Then we will create our namespace for the observability tools:
$ kubectl create ns observability
Installing Promtail
To install Promtail, run:
$ cd promtail
$ helm upgrade --install promtail grafana/promtail -n observability -f promtail.yaml
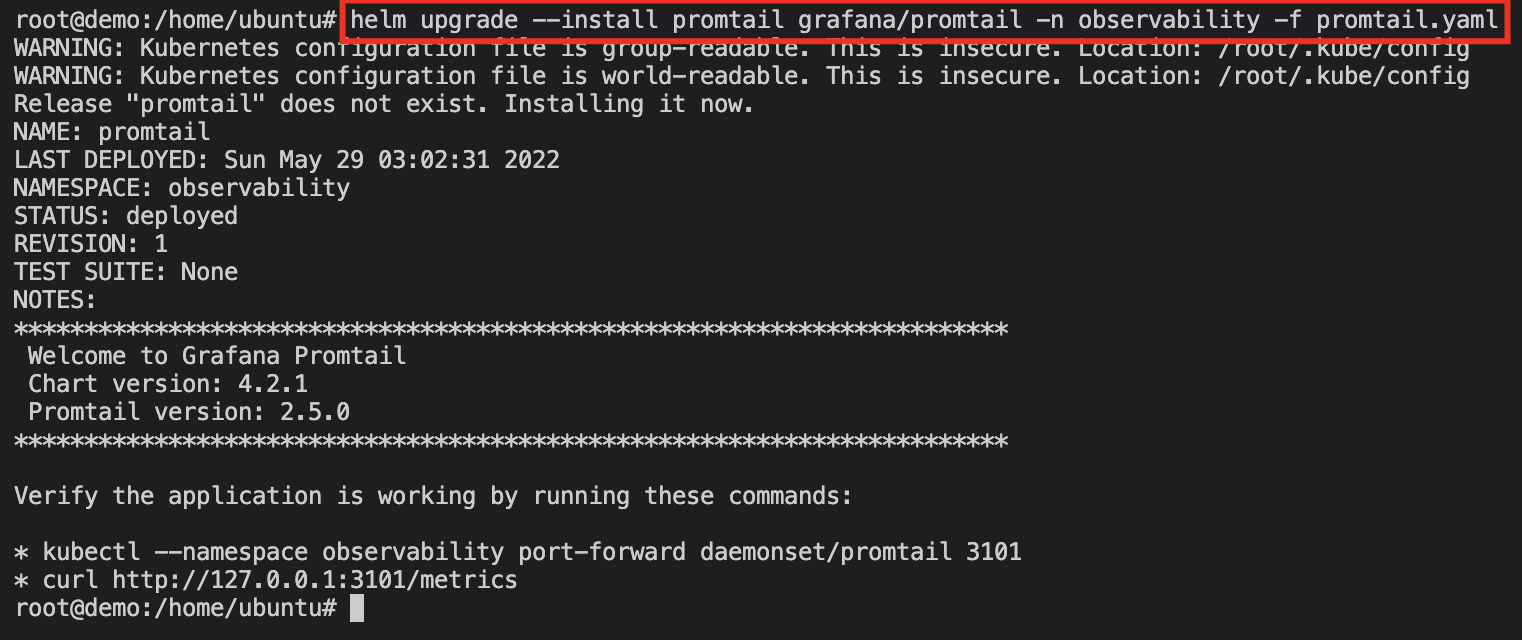
It is important that
Promtailpoints toLokiservice calledloki-loki-distributed-gateway.
Installing Loki
Deploy Loki inside the cluster by running:
$ helm upgrade --install loki grafana/loki-distributed -n observability
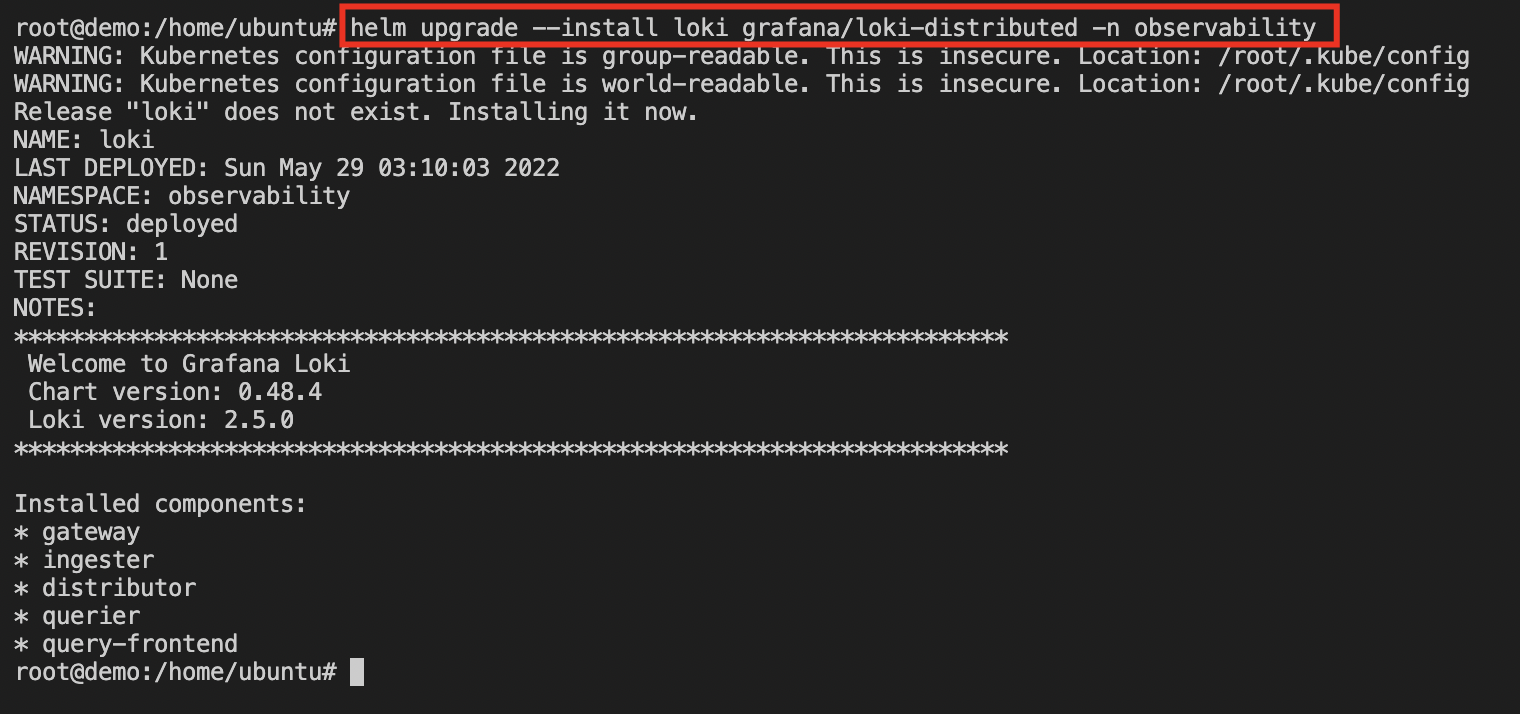
Here we are interested in the
loki-loki-distributed-gatewayservice created byLoki,Promtailwill need it to send the logs andGrafanawill also need it to create it as datasource.
Installing Tempo
We locate ourselves in the directory where the manifests are located:
$ cd ../tempo
To install Tempo as a prerequisite we need to install minio you can find the repository here. It is a tool that helps us to simulate an AWS Object Storage s3 service.
For this, run:
$ kubectl apply -f minio.yaml
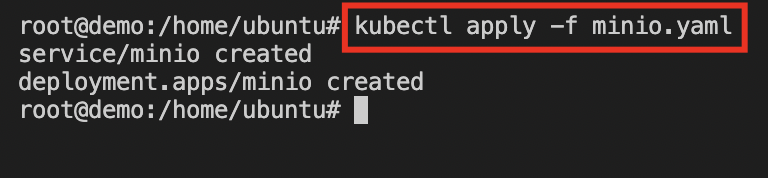
Minio is deployed in the default namespace, since it is a more generic tool for Object Storage, not directly for observability.
Now, to deploy Tempo, run:
$ helm upgrade --install tempo grafana/tempo-distributed -n observability -f tempo.yaml
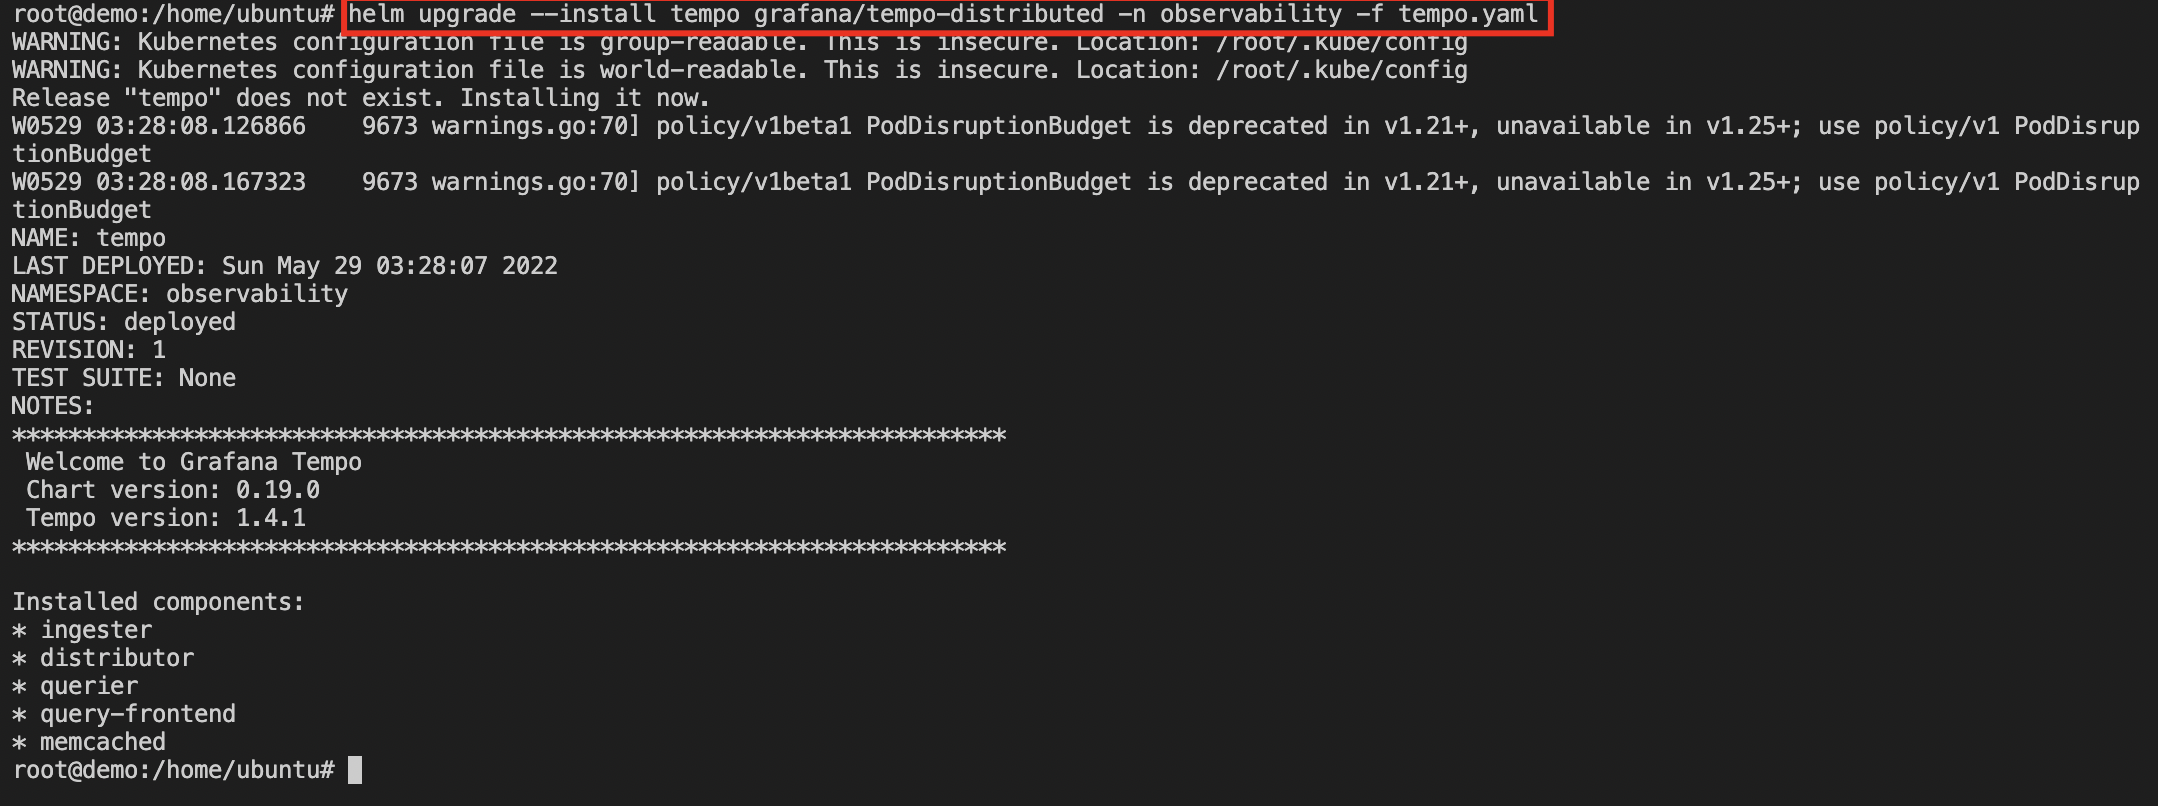
Here we are interested in the
tempo-tempo-distributed-query-frontendservice that uses port3100, sinceGrafanawill need it to create it as a datasource.
Installing Prometheus and Grafana
To install Prometheus and Grafana we use this Git repository Github.
$ helm repo add prometheus-community https://prometheus-community.github.io/helm-charts
$ helm repo update
After adding the helm repo to use, let's run it:
$ cd ../prometheus-grafana
$ helm dependency update
helm upgrade --install kube-prometheus-stack -n observability .
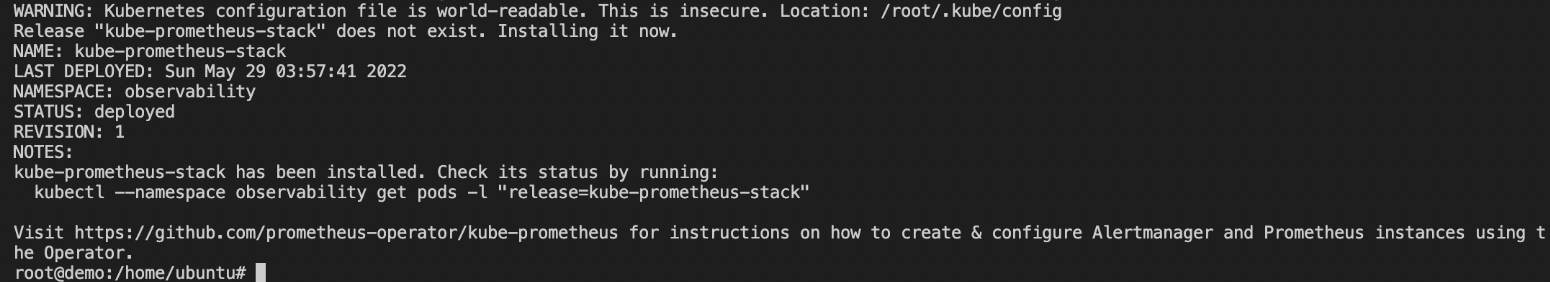
With this we automate the generation of datasources (Prometheus, Loki, Tempo) and dashboards of Grafana, also we will allow anonymous access to Grafana, since it is a demo. For production environment it is necessary to add authentication.
Checking our deployments
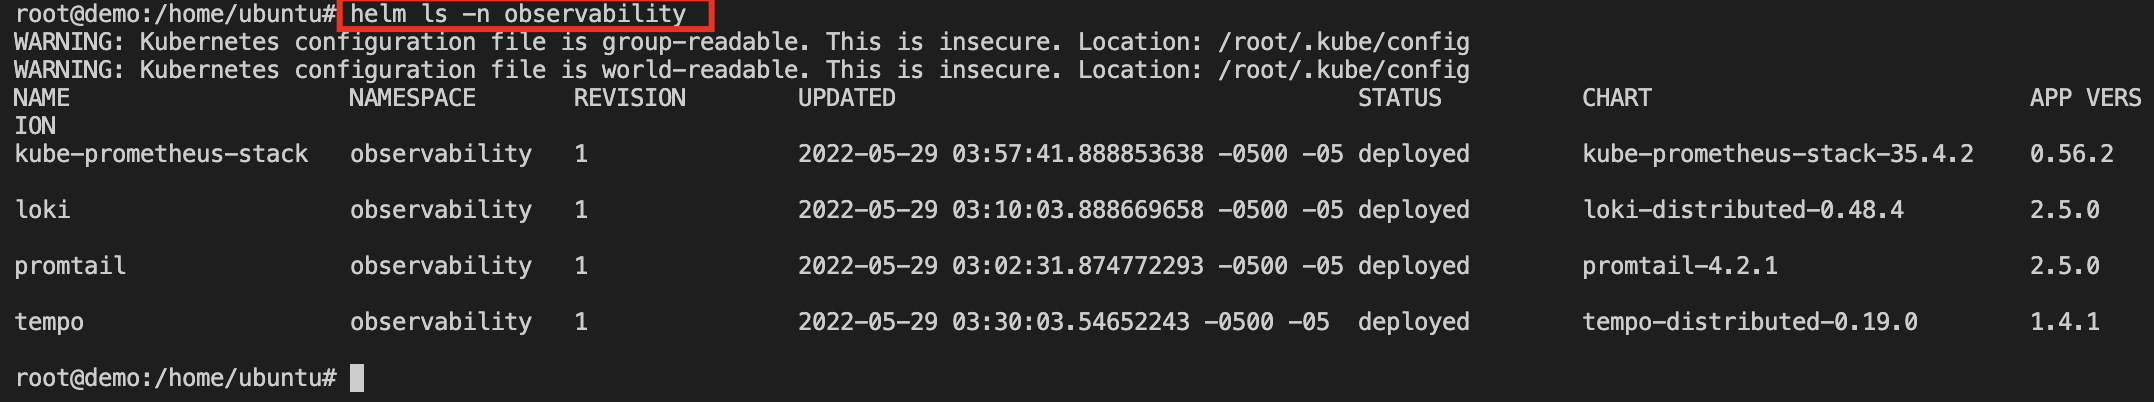
$ helm ls -n observability
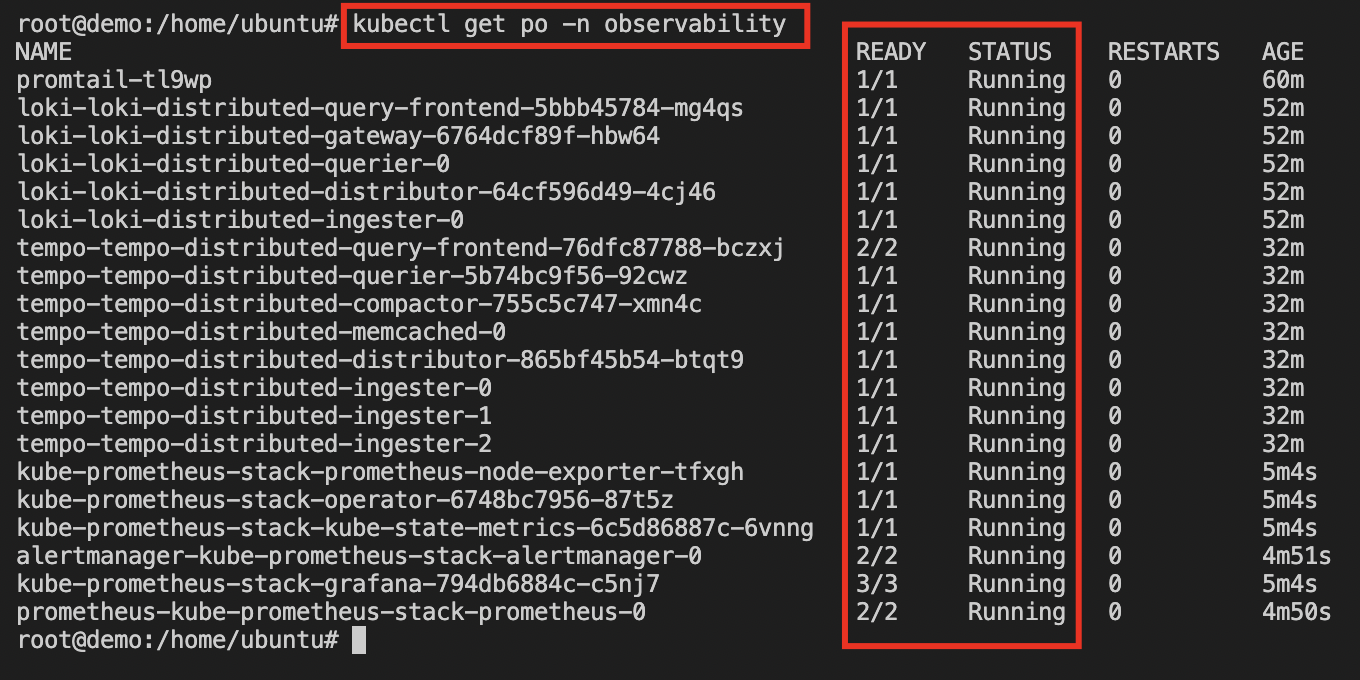
$ kubectl get po -n observability
$ kubectl get svc -n observability
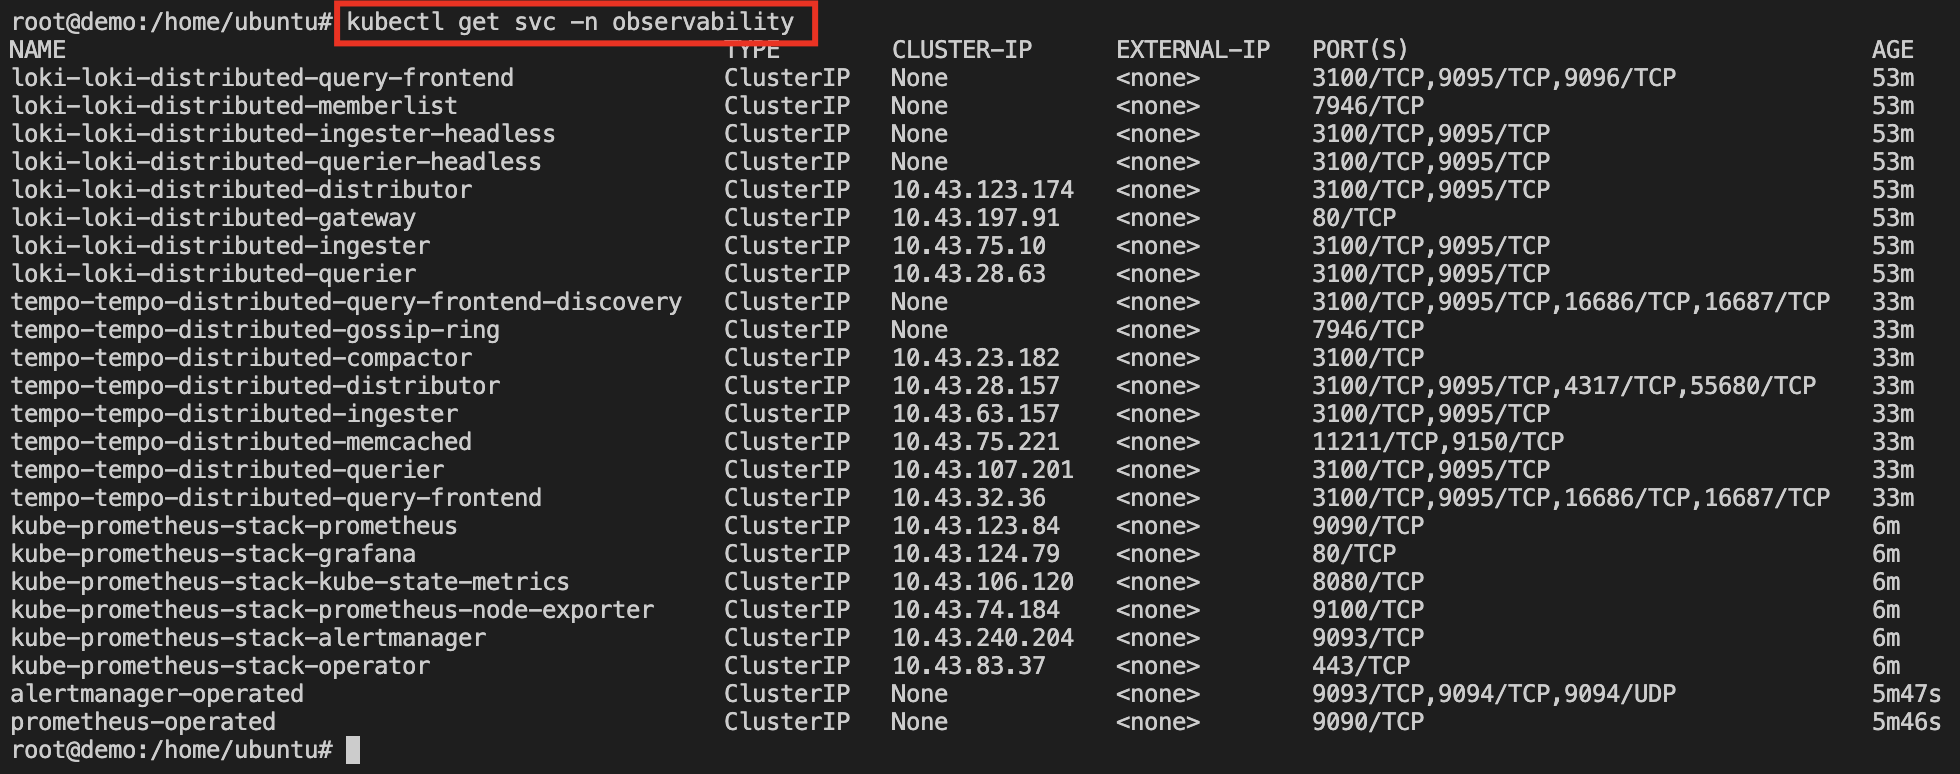
We can see that our observability tools were successfully deployed on our single-node Kubernetes cluster.
Deploying our Spring Boot Application on Kubernetes
To deploy it we are going to enter the directory where the manifest is located:
$ cd ../springboot-app
It is important to identify these configurations for it to work:
Our Service configuration must have these annotations so that it can send metrics to prometheus.
  annotations:
    # Annotations for Prometheus - scrape config
    prometheus.io/path: '/actuator/prometheus'
    prometheus.io/port: 'actuator'
    prometheus.io/scrape: 'true'
Another very important one is to add the environment variables for Deployment, for communication with OpenTelemetry:
          env:
            - name: SERVER_PORT
              value: '8080'
            - name: MANAGEMENT_SERVER_PORT
              value: '8081'
            # Setting OTEL_EXPORTER_METRICS: none - Default: OTLP
            - name: OTEL_METRICS_EXPORTER
              value: none
            - name: OTEL_TRACES_EXPORTER
              value: otlp,logging
            # Setting Tempo Distributor Service using GRPC Port -> 4317
            - name: OTEL_EXPORTER_OTLP_ENDPOINT
              value: http://tempo-tempo-distributed-distributor.observability.svc.cluster.local:4317
            - name: OTEL_SERVICE_NAME
              value: springboot-app
            - name: KUBE_POD_NAME
              valueFrom:
                fieldRef:
                  fieldPath: metadata.name
            - name: OTEL_RESOURCE_ATTRIBUTES
              value: app=springboot-app
And finally we have the ConfigMap that contains our Grafana Dashboard for Spring Boot, this will allow us to see how Exemplar correlates with Tempo through metrics such as Request Latency.
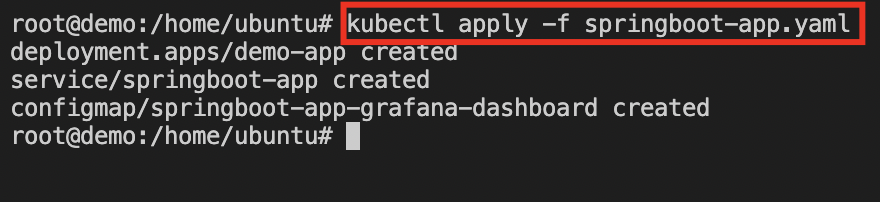
Having explained this, we can now run our manifest:
kubectl apply -f springboot-app.yaml
Verify the created resources of our application by running:
$ kubectl get deploy,svc,cm -l app=springboot-app
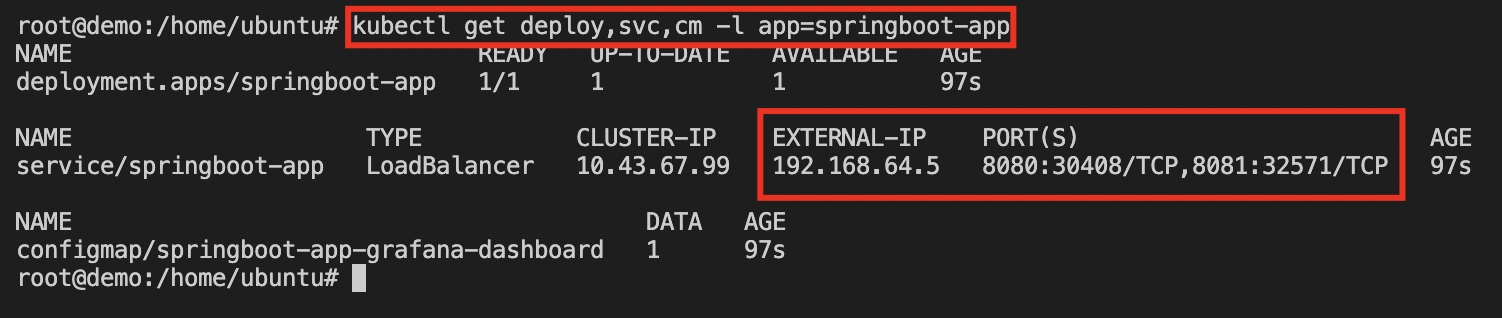
We can see that everything deployed correctly, we can also see the external-ip of our Spring Boot Application 192.168.64.5 using port 8080 for our /fail and /success endpoints. The management port uses 8081 for the /actuator endpoints, the one we are interested in is /actuator/prometheus.
Testing endpoints
With the above information we just need to go to the browser and enter our endpoints:
Testing /fail -> http://{external-ip}:8080/fail, in my case:
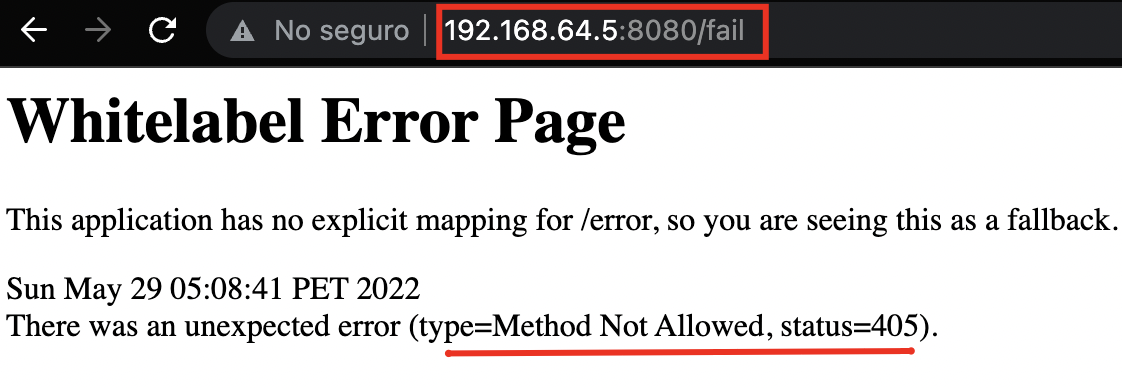
Effectively it returns a Method Not Allowed 405 Error.
Testing /success -> http://{external-ip}:8080/success, in my case:
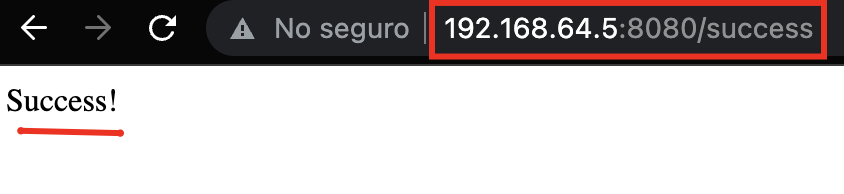
Effectively it returns success.
Testing /actuator/prometheus -> http://{external-ip}:8081/actuator/prometheus, in my case:
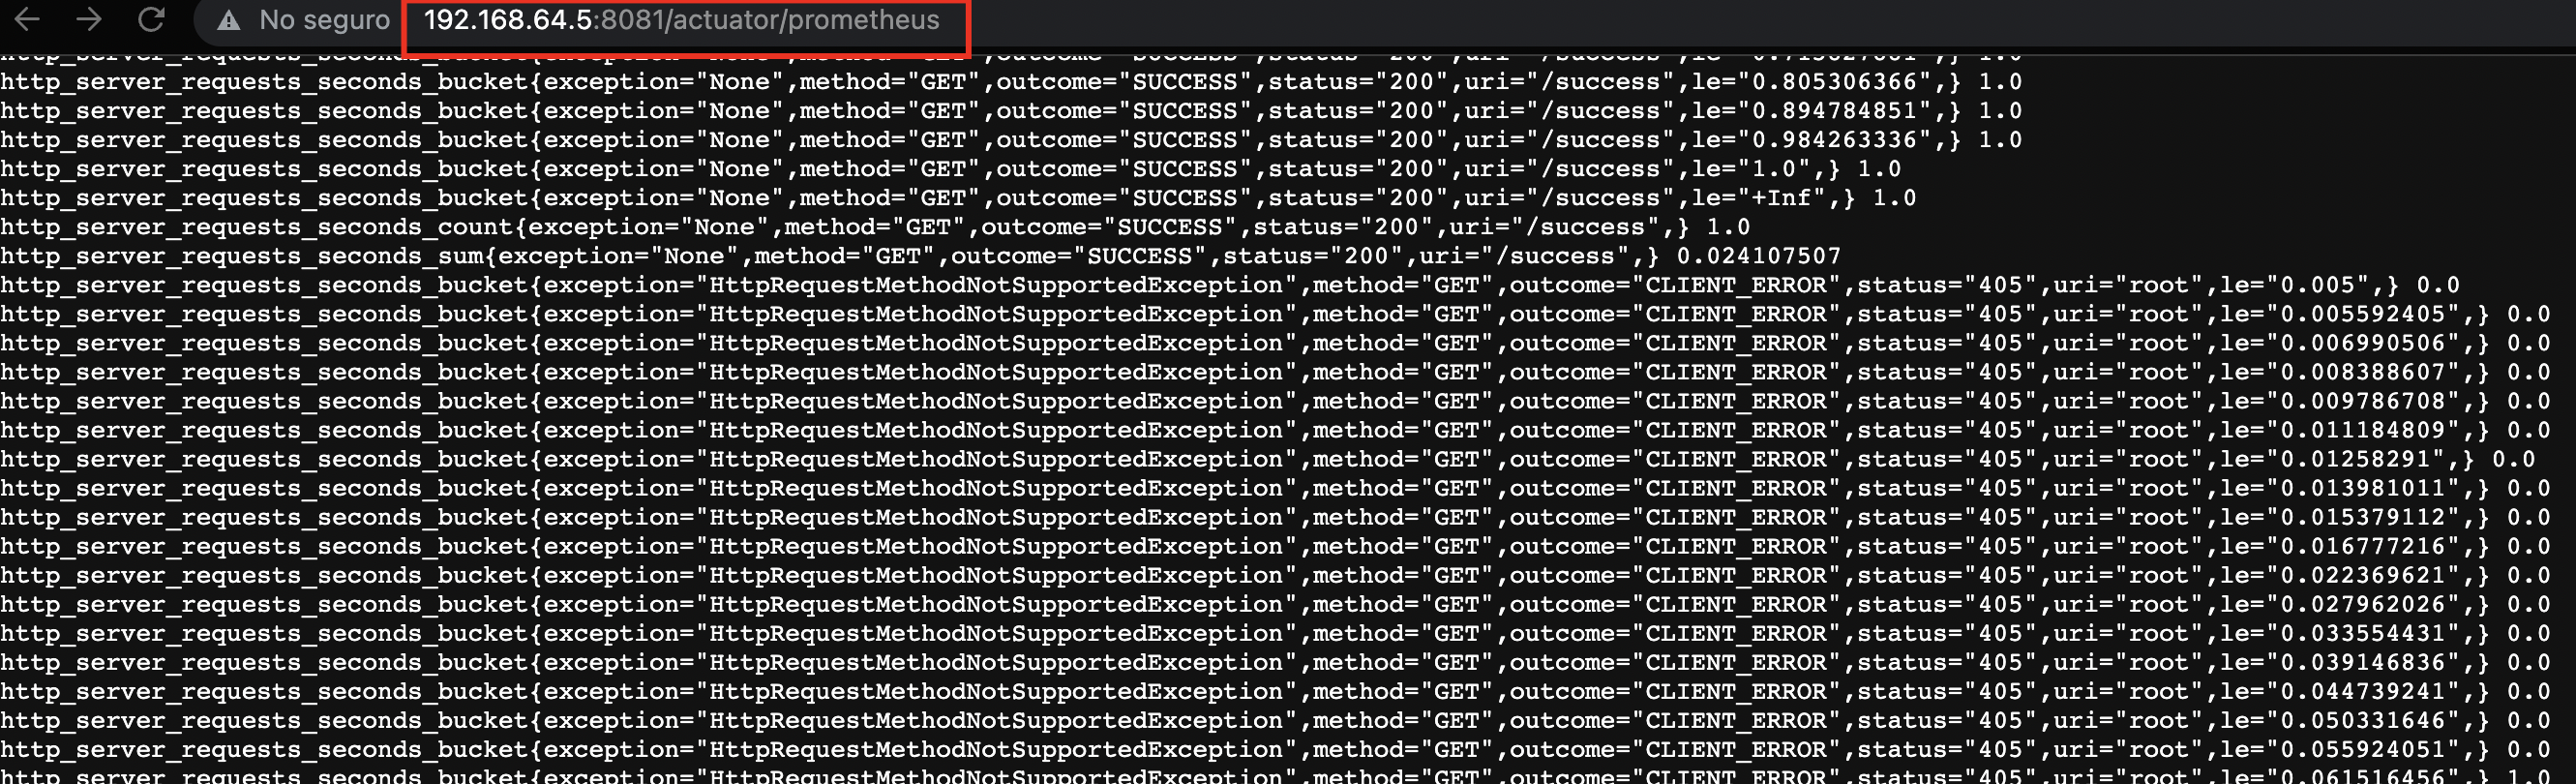
We can see that it returns the metrics correctly.
Testing Grafana
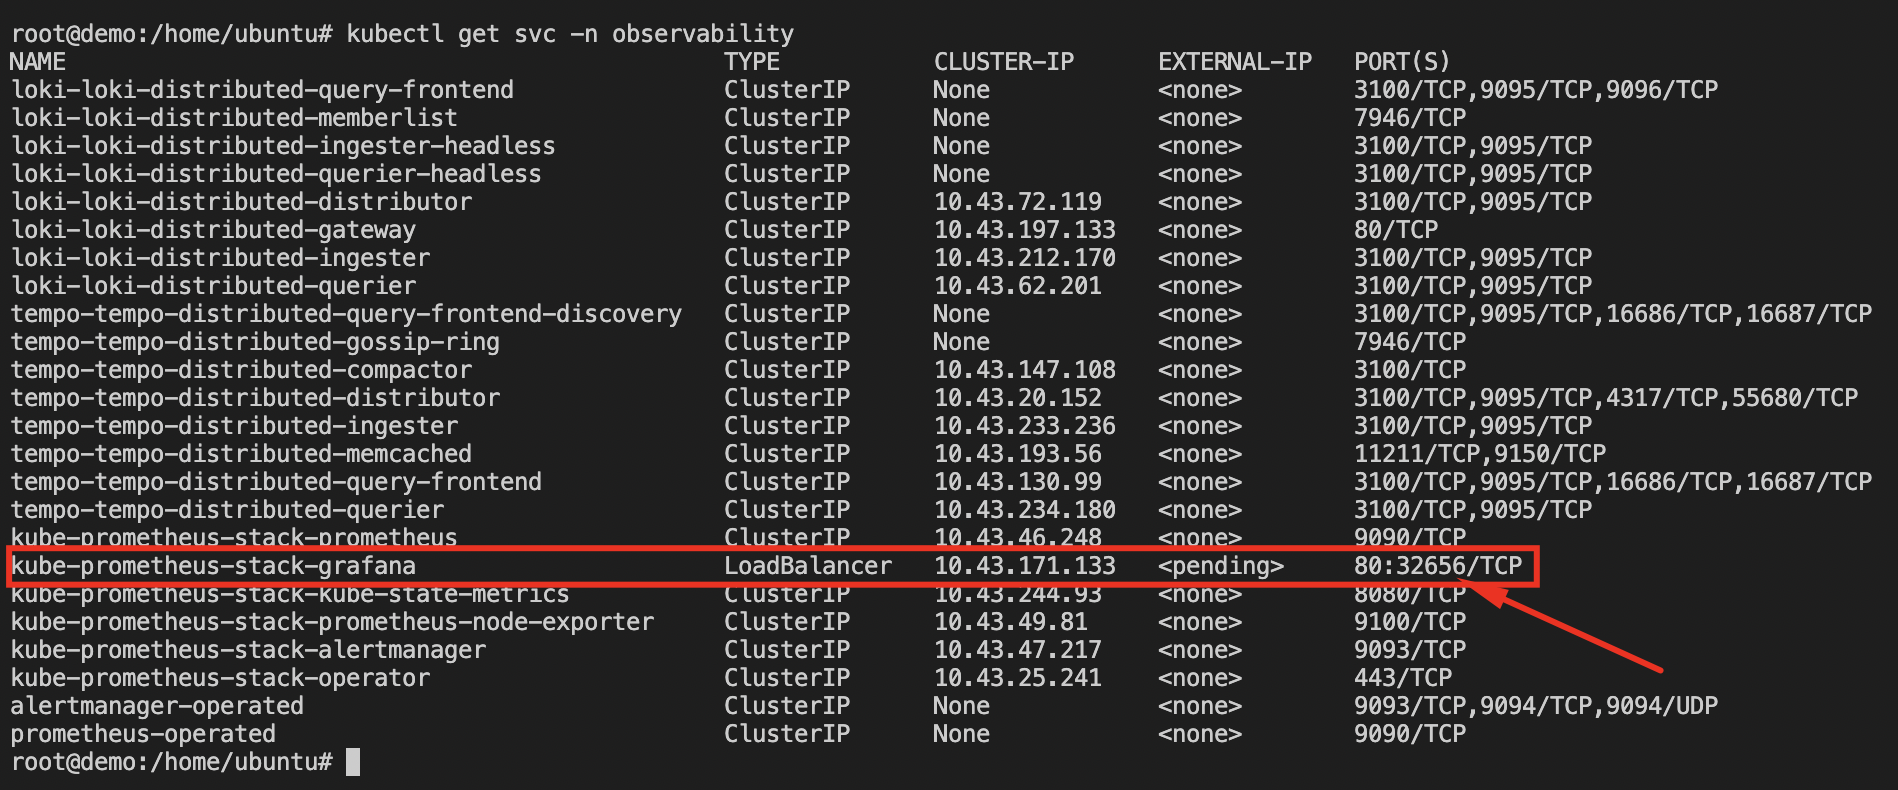
Now we have everything configured, ready to perform our troubleshooting process. In order to open grafana, we need to obtain the port, run:
kubectl get svc -n observability
Identify the port, in my case: 32656
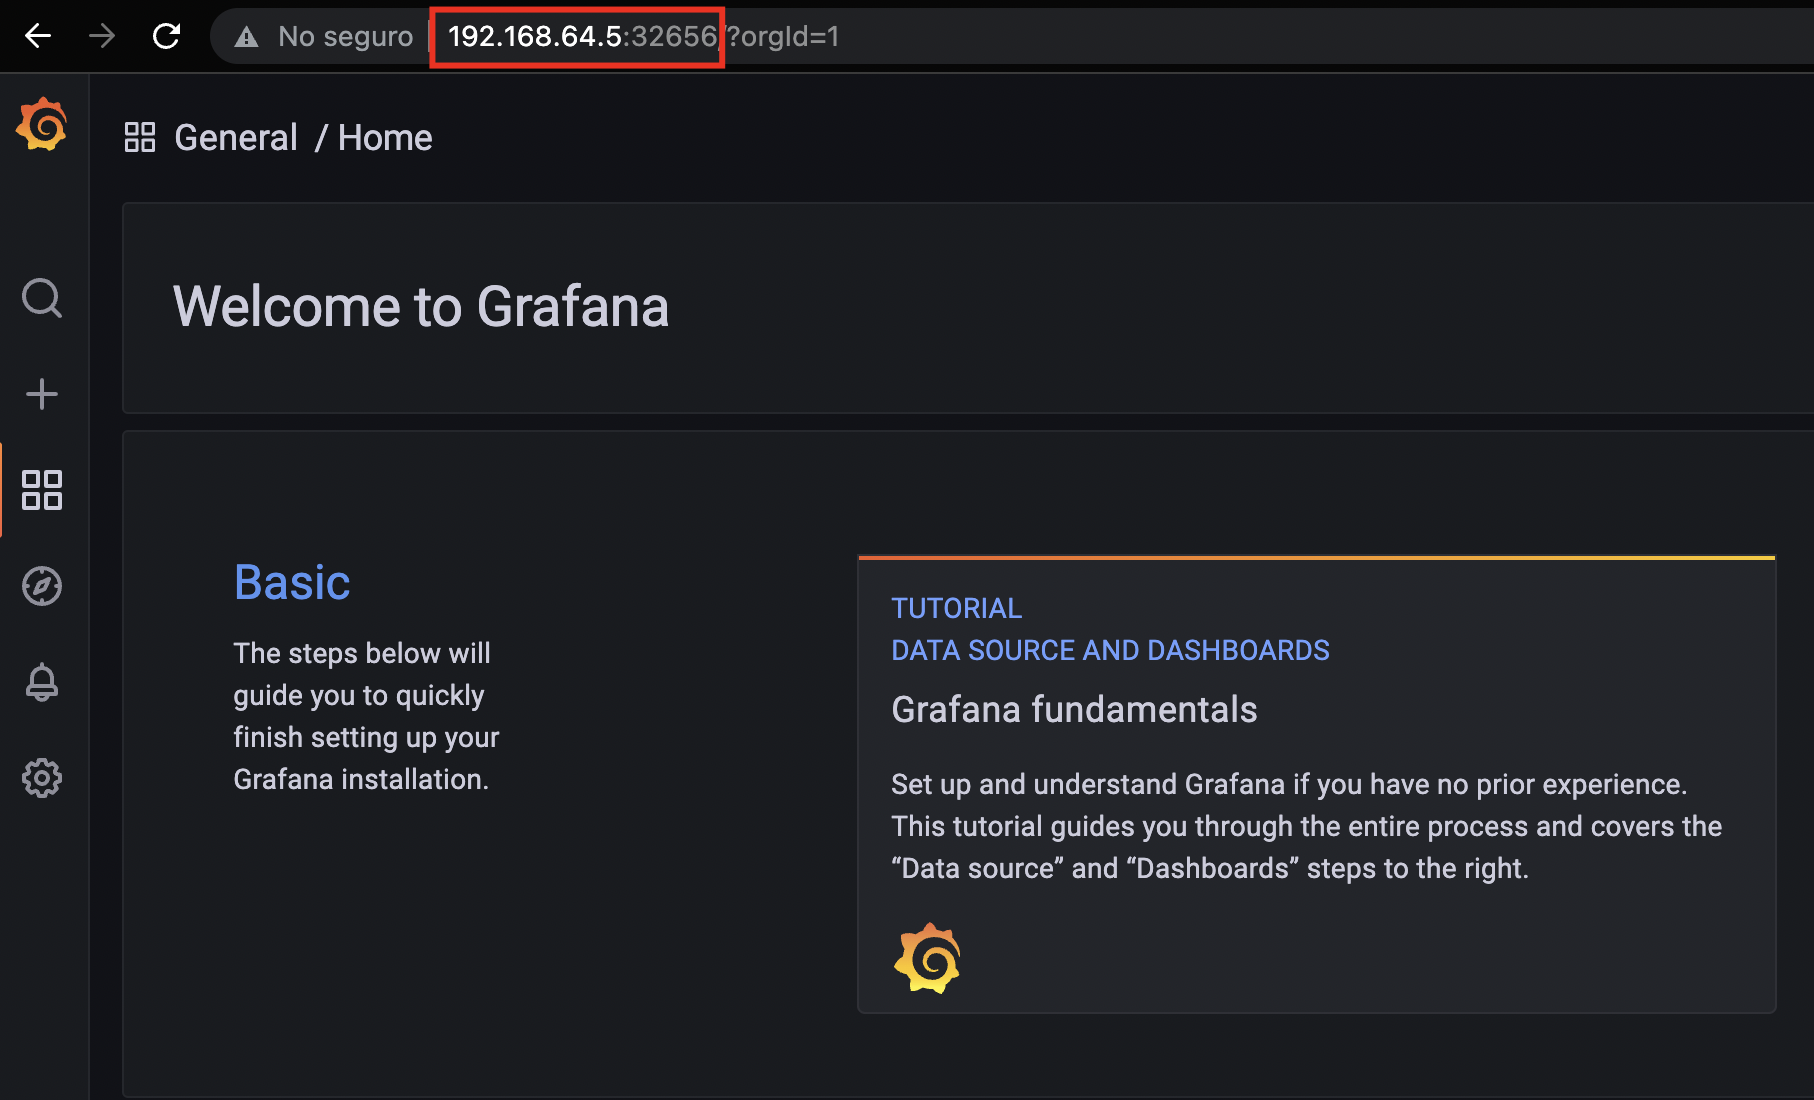
Go to the browser -> http://{external-ip}:32656 :
We will validate that our automated datasources are imported:
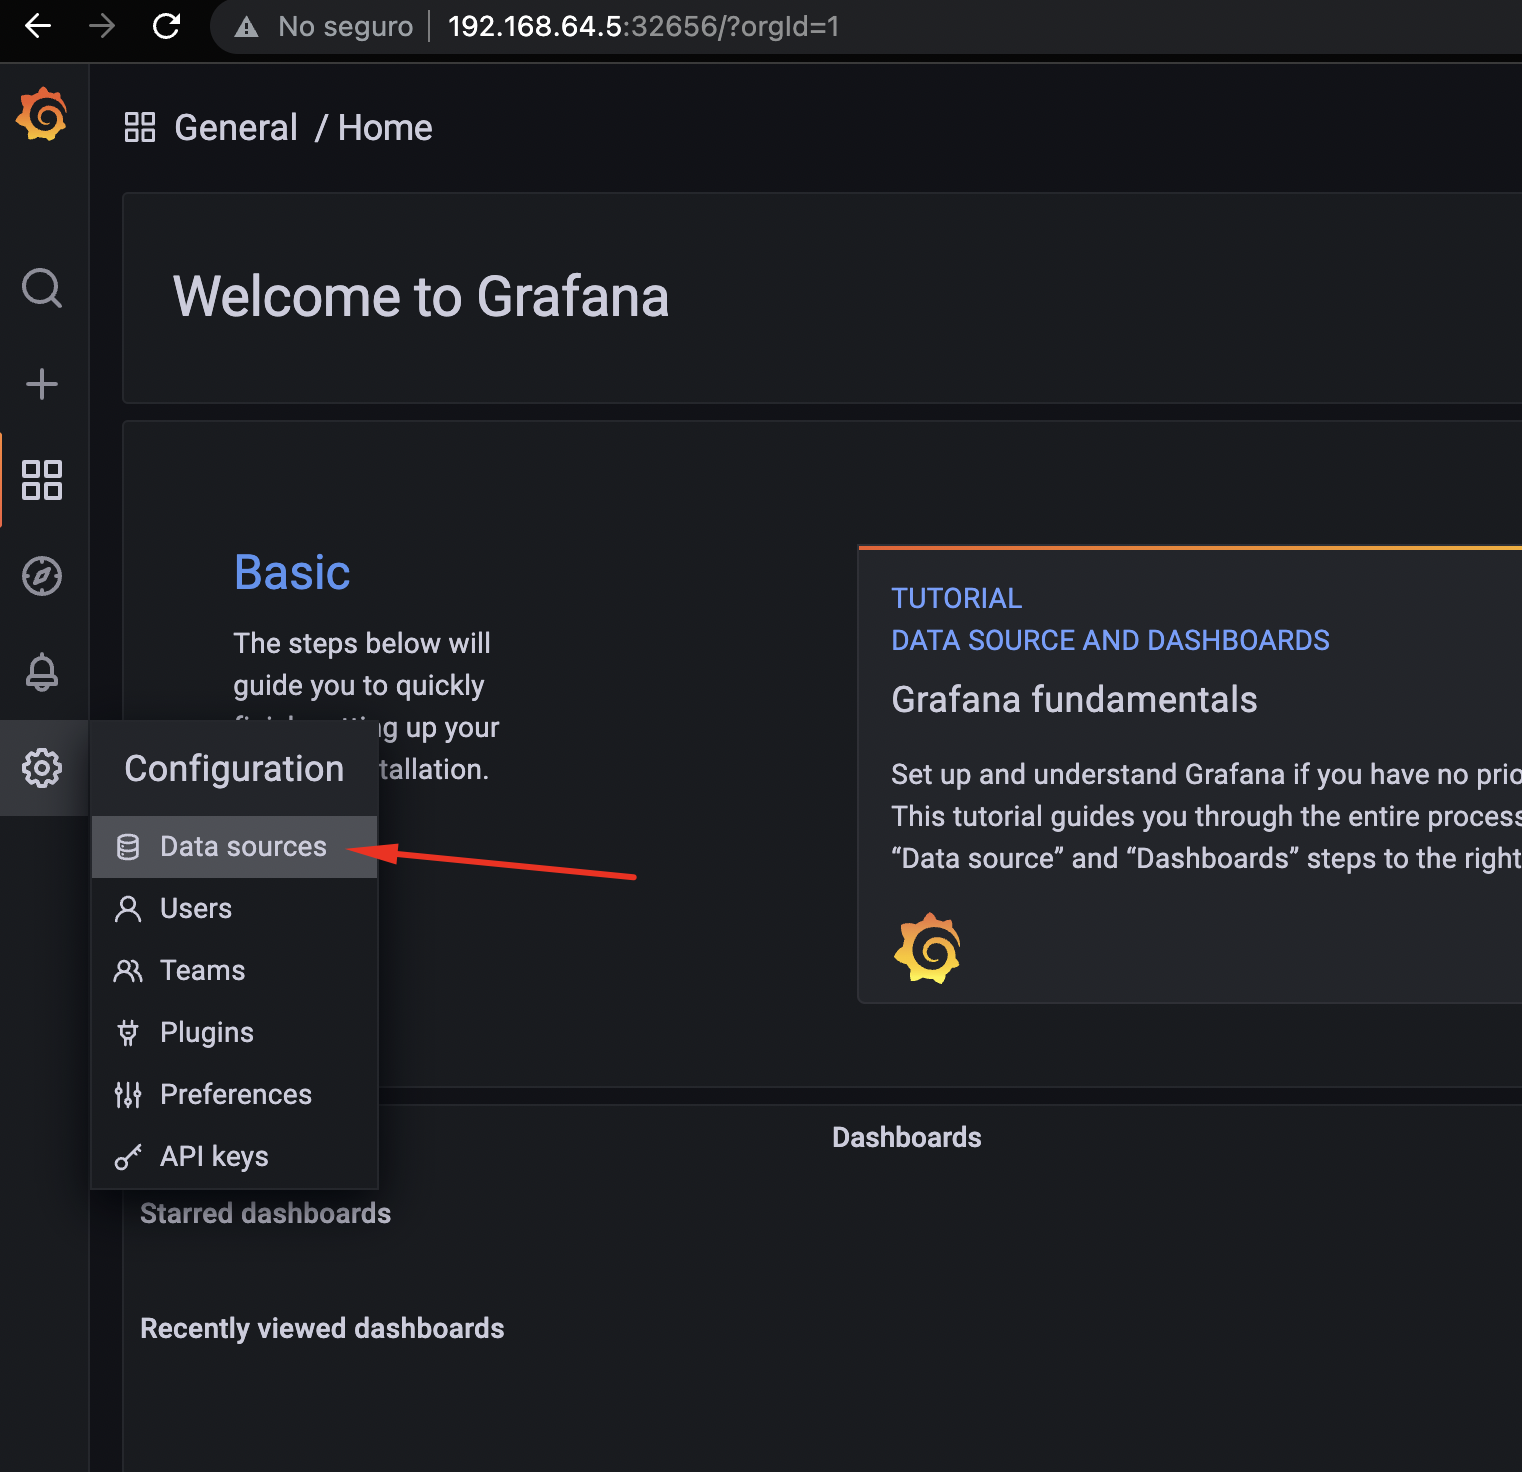
We can see Prometheus, Loki, Tempo configured and we can test the connections:
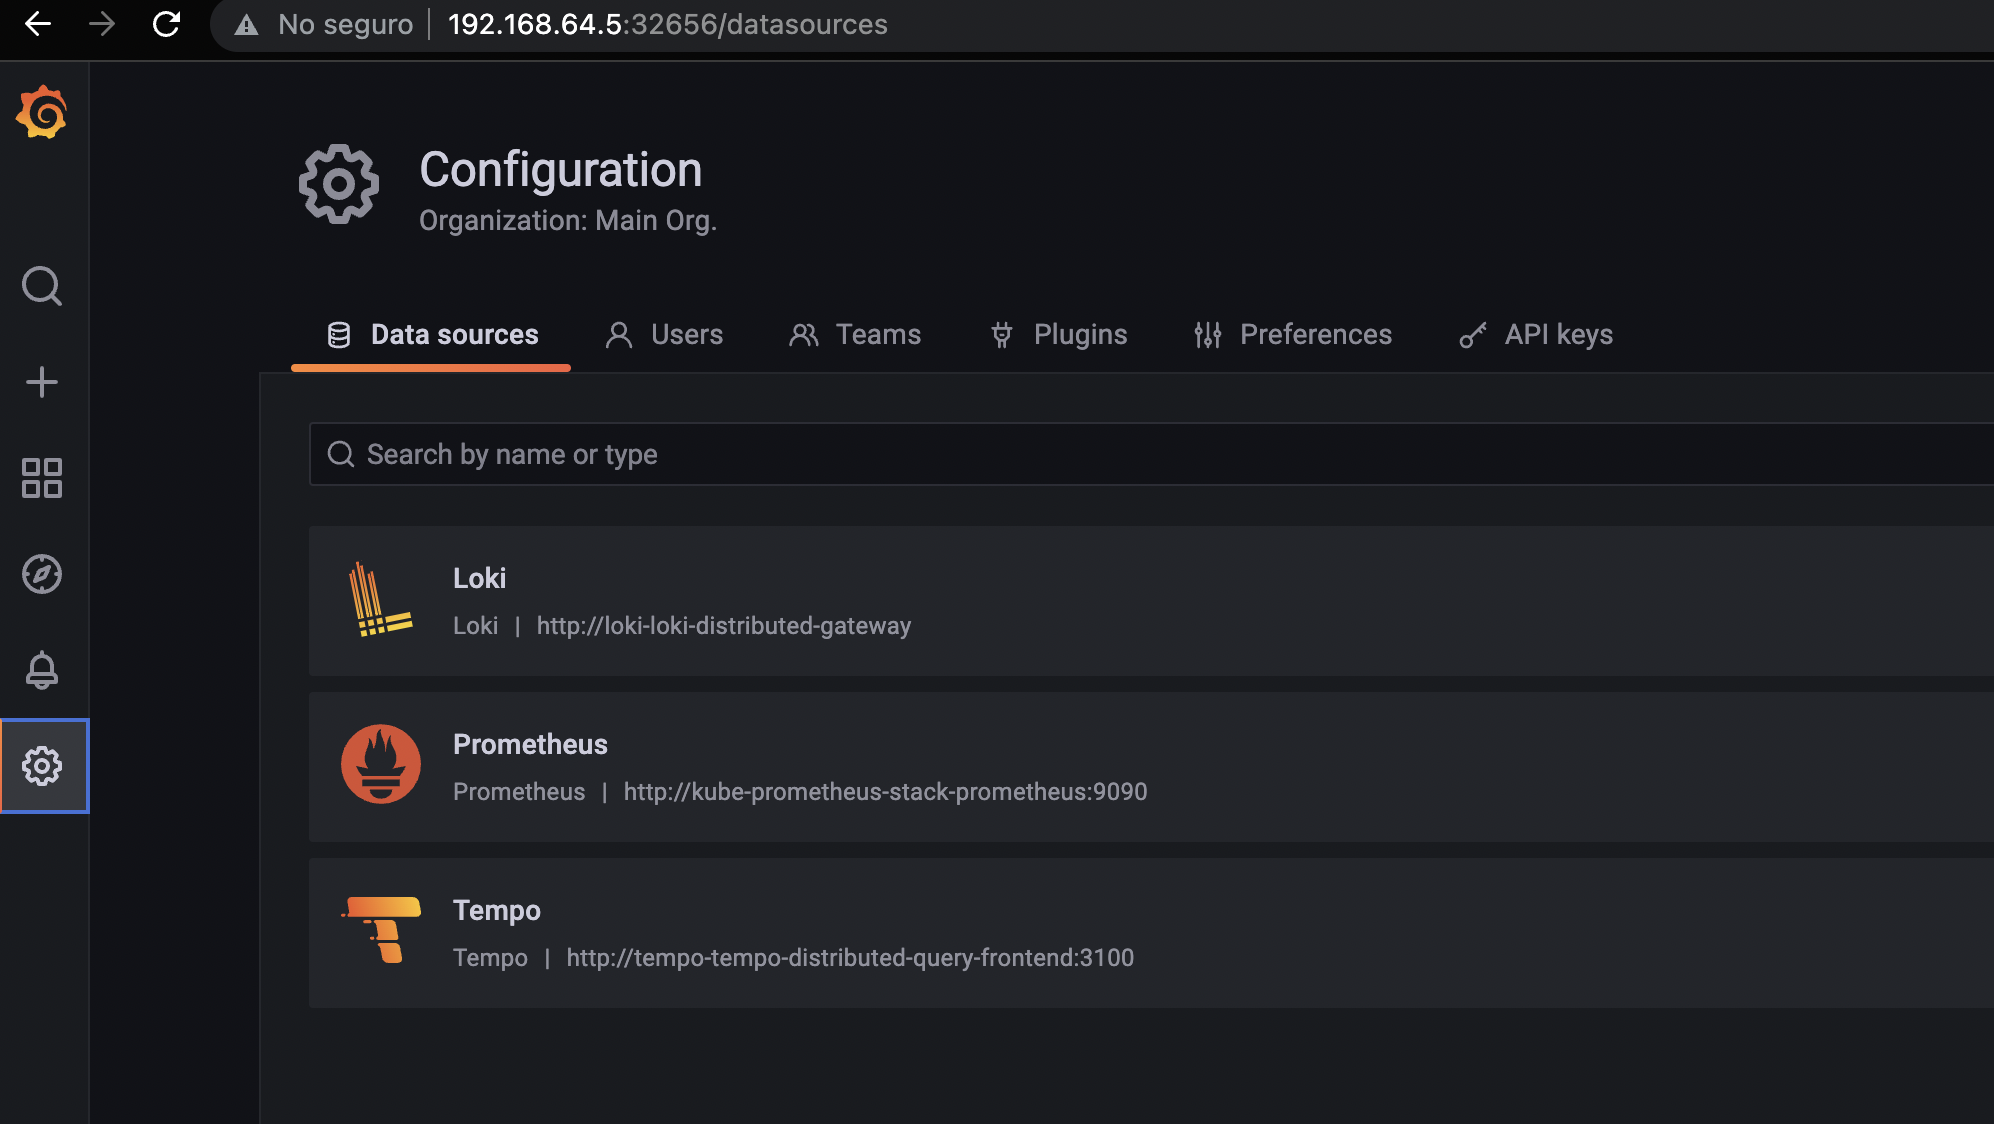
Prometheus:
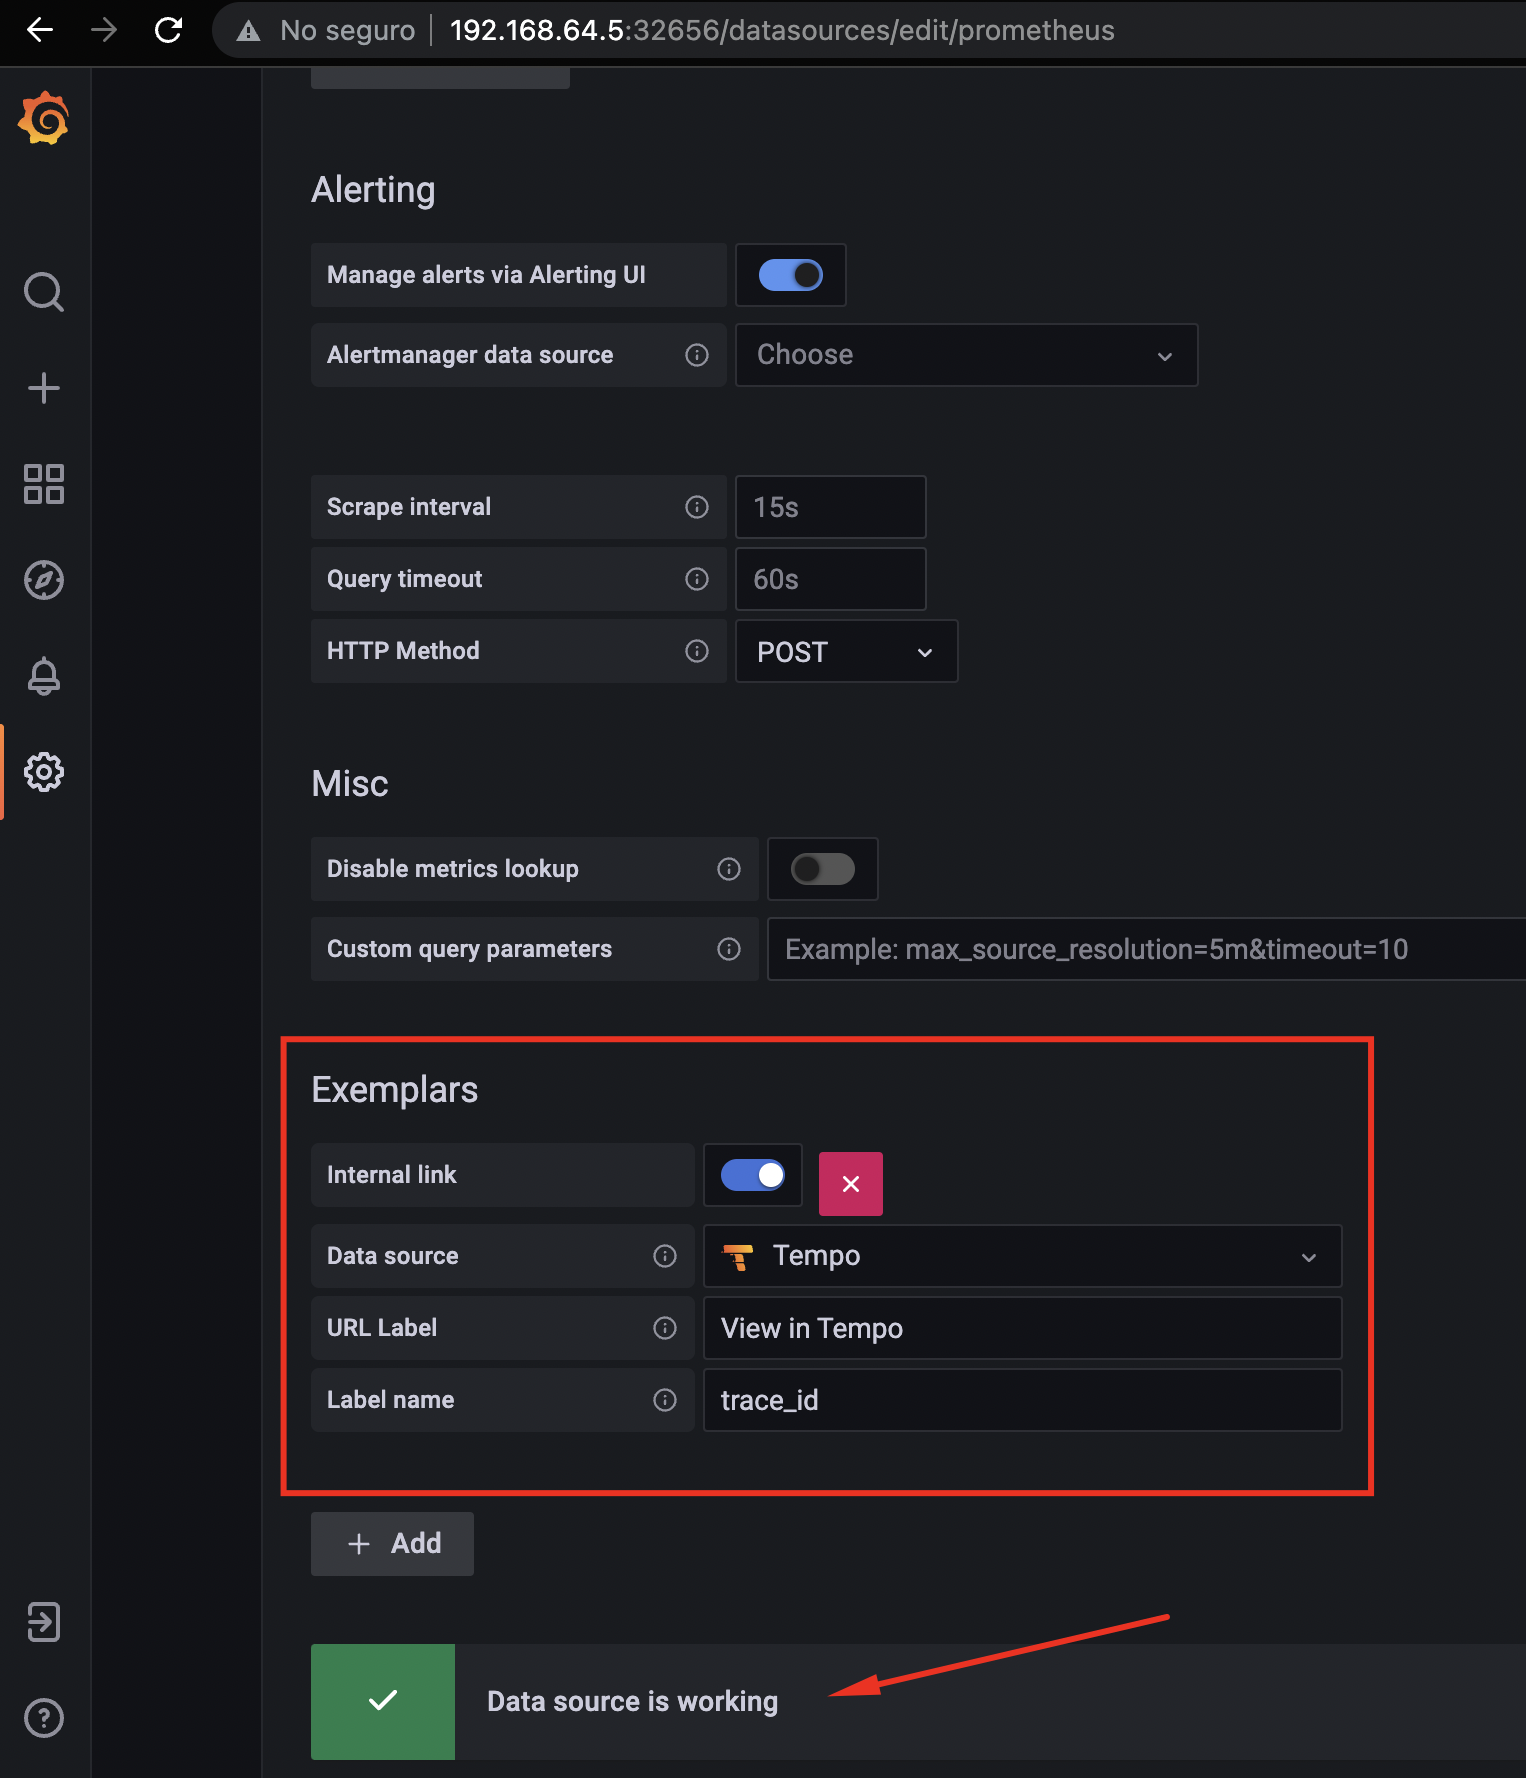
We can see
PrometheusandTempocorrelated bytrace_id, using Exemplars.
Loki:
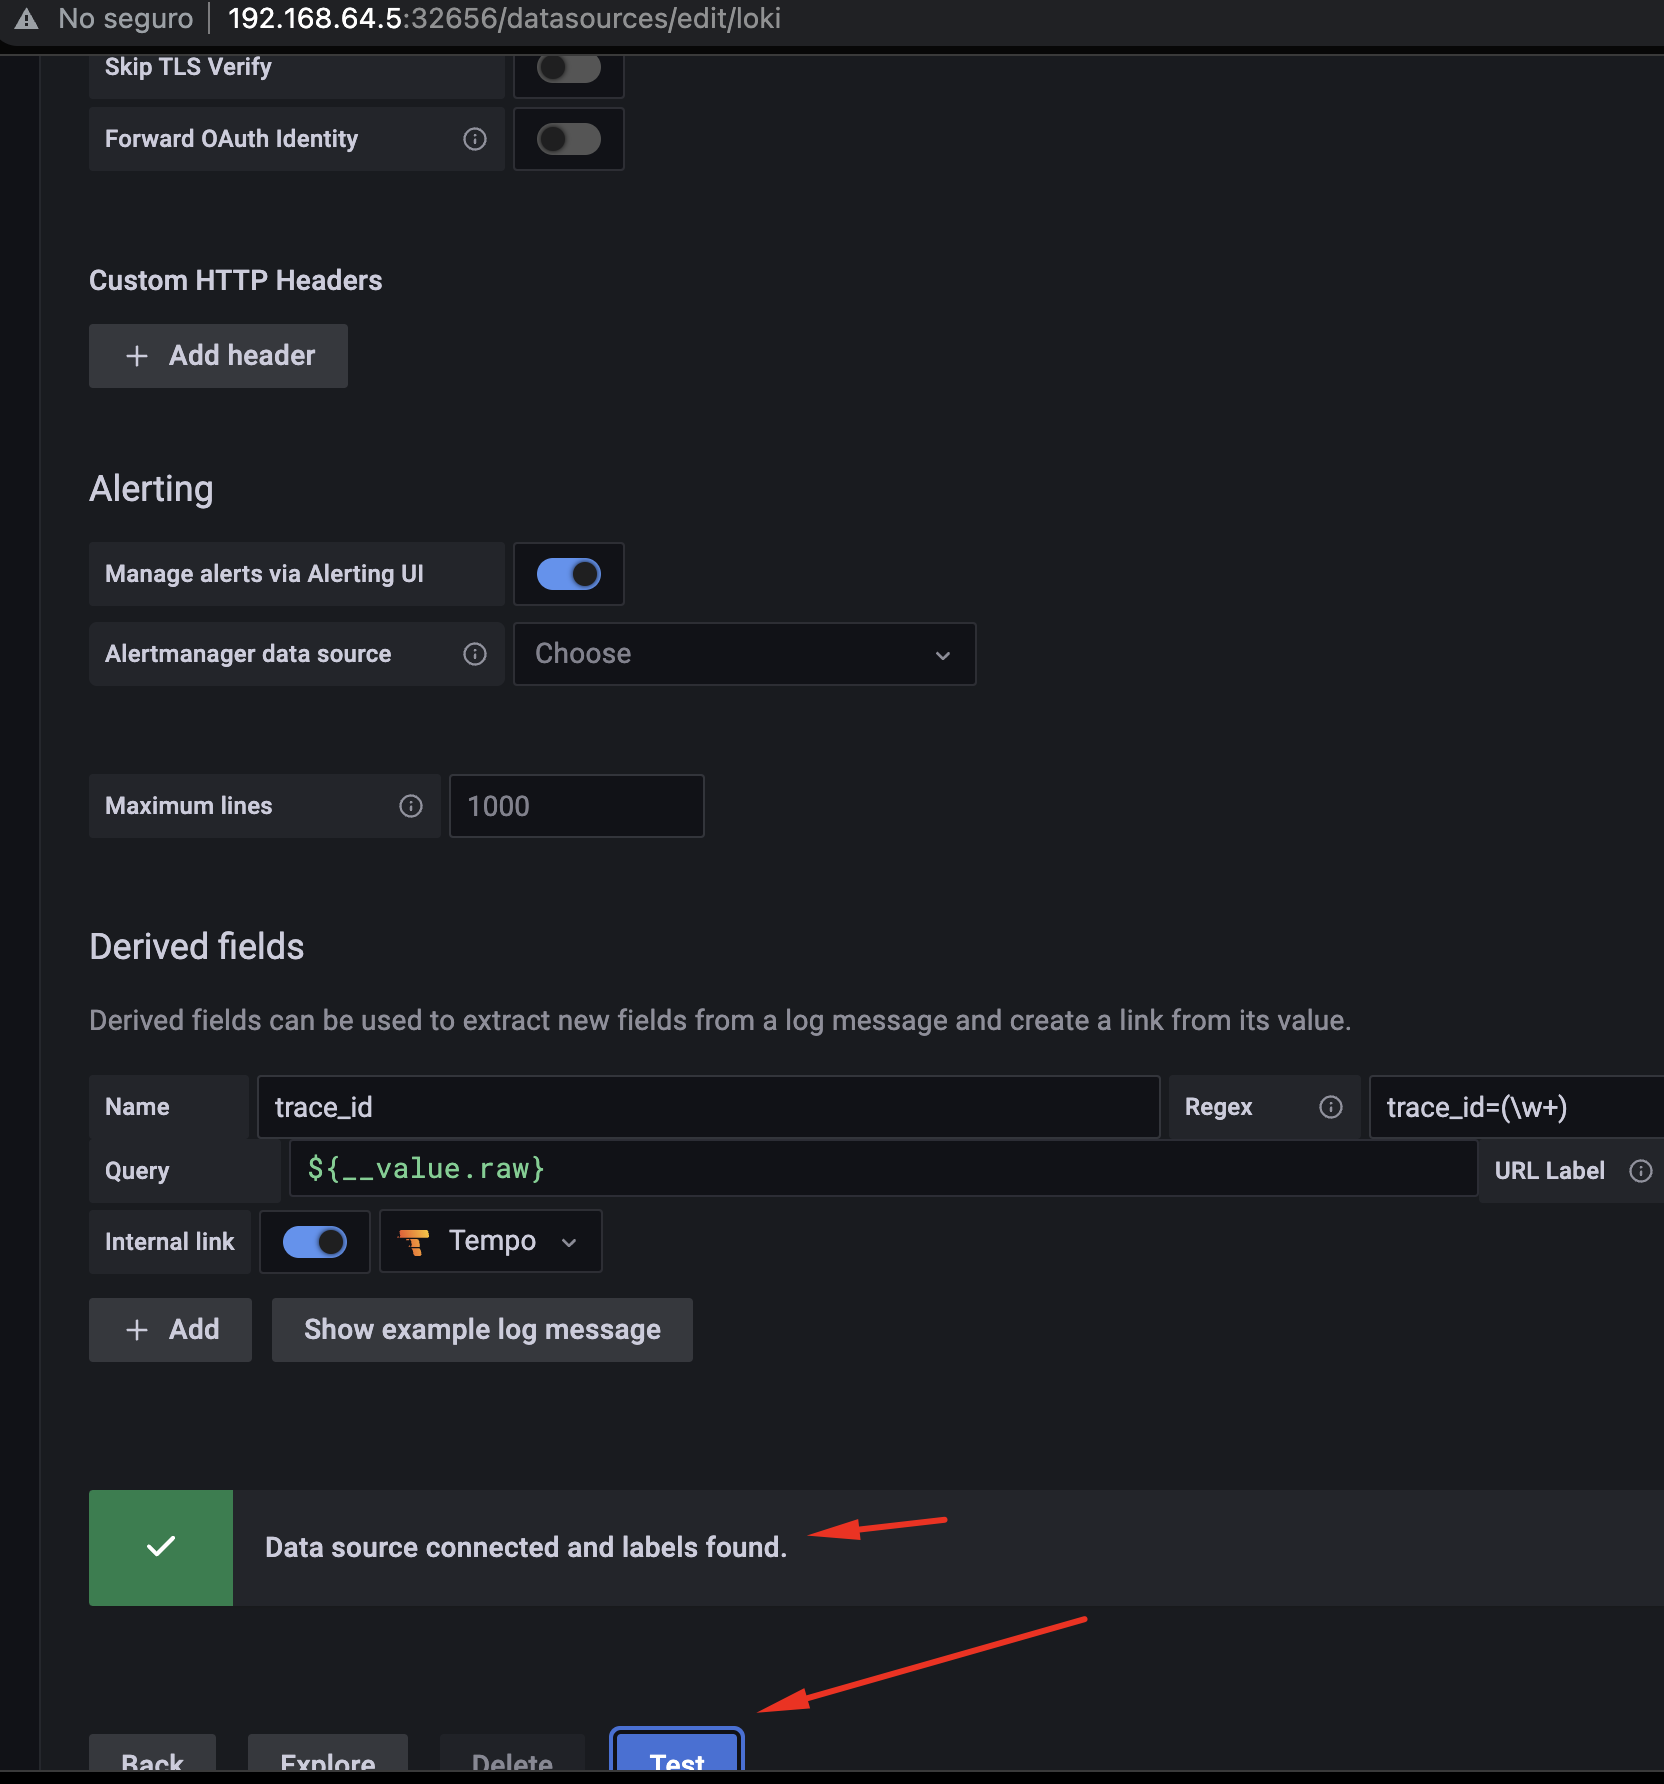
We can see
LokiandTempocorrelated bytrace_idin the log.
Tempo:
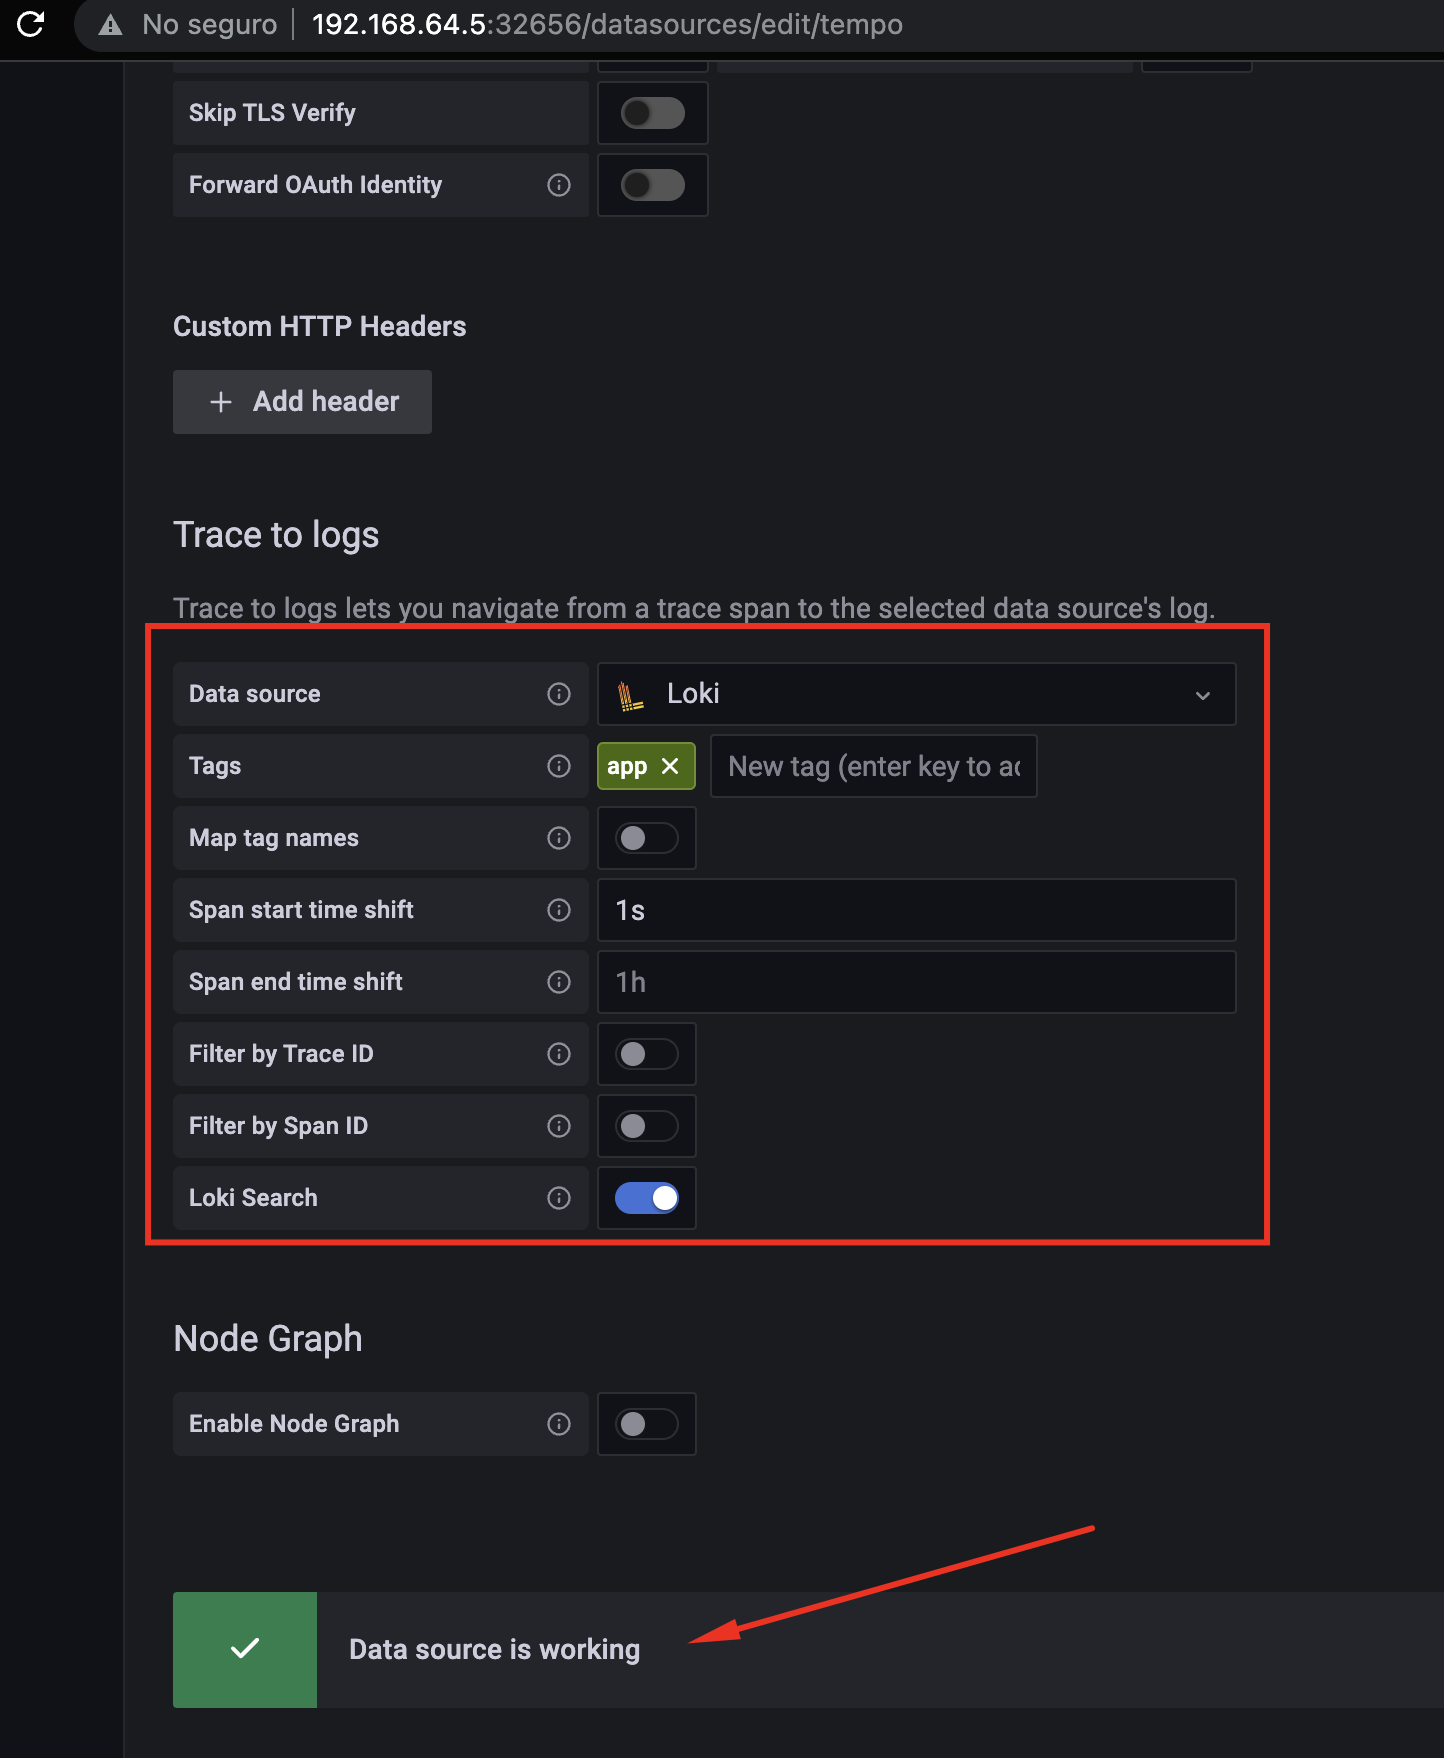
We can see that here we correlate
TempowithLokiand map theapptag that we configured in the microservice.
- Let's put it to the test
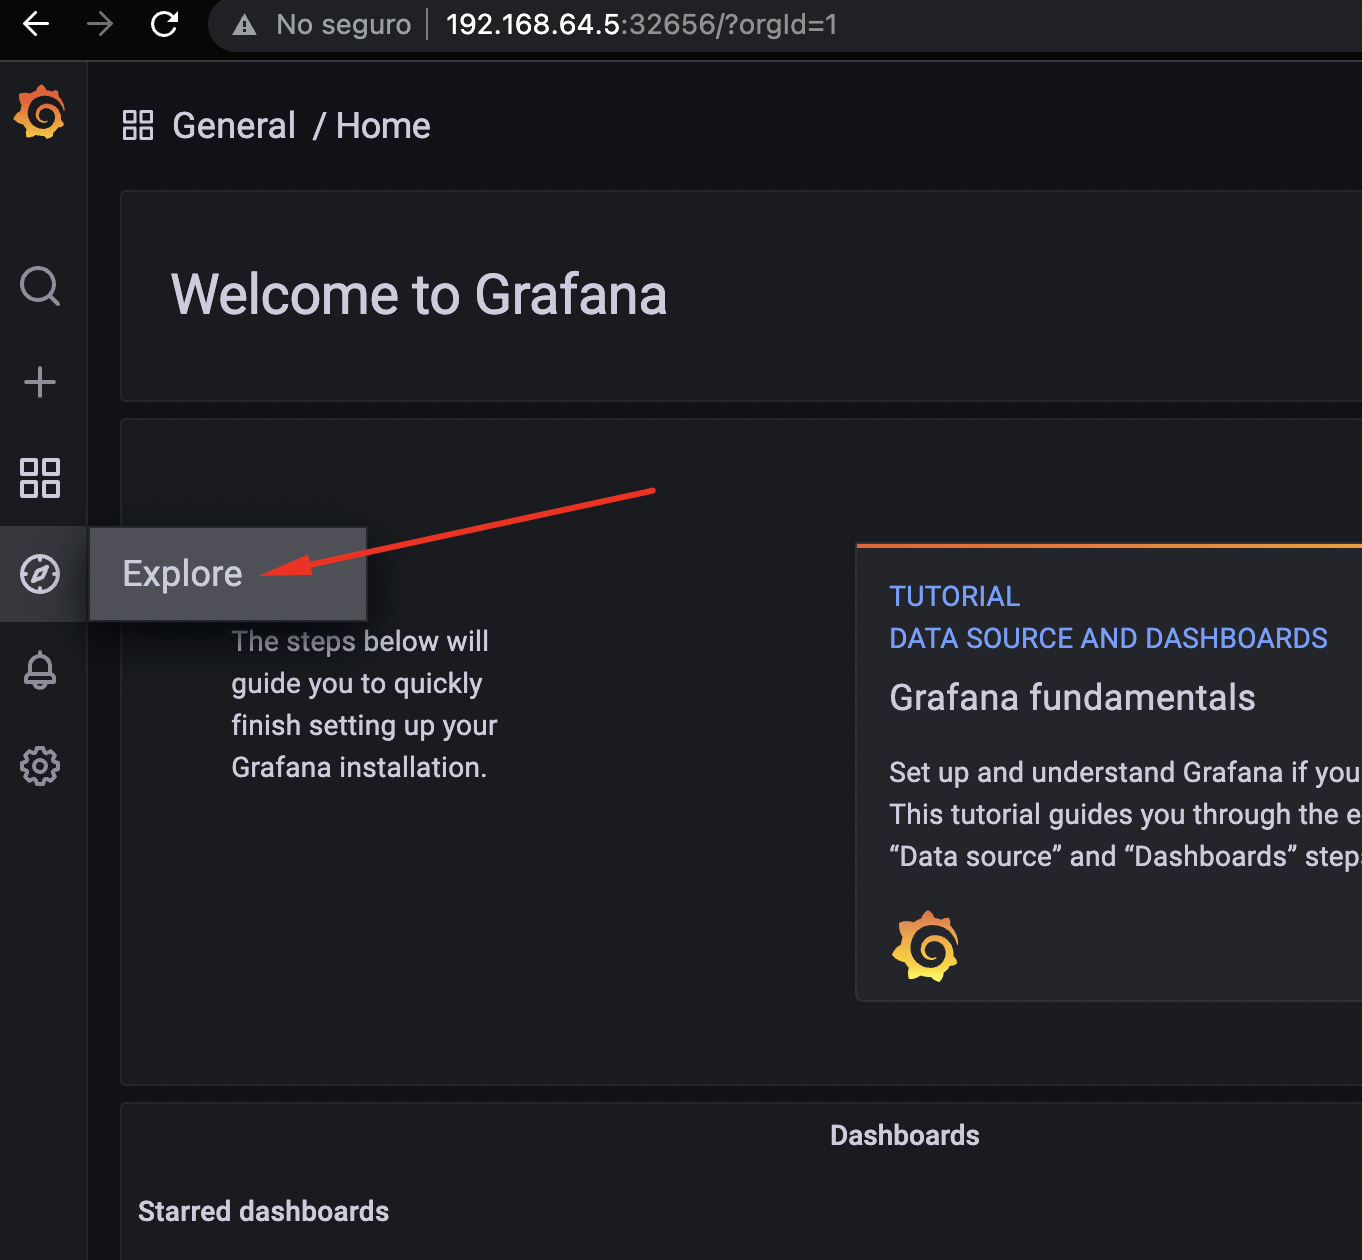
We will see the log of our Spring Boot application, go to Explore:
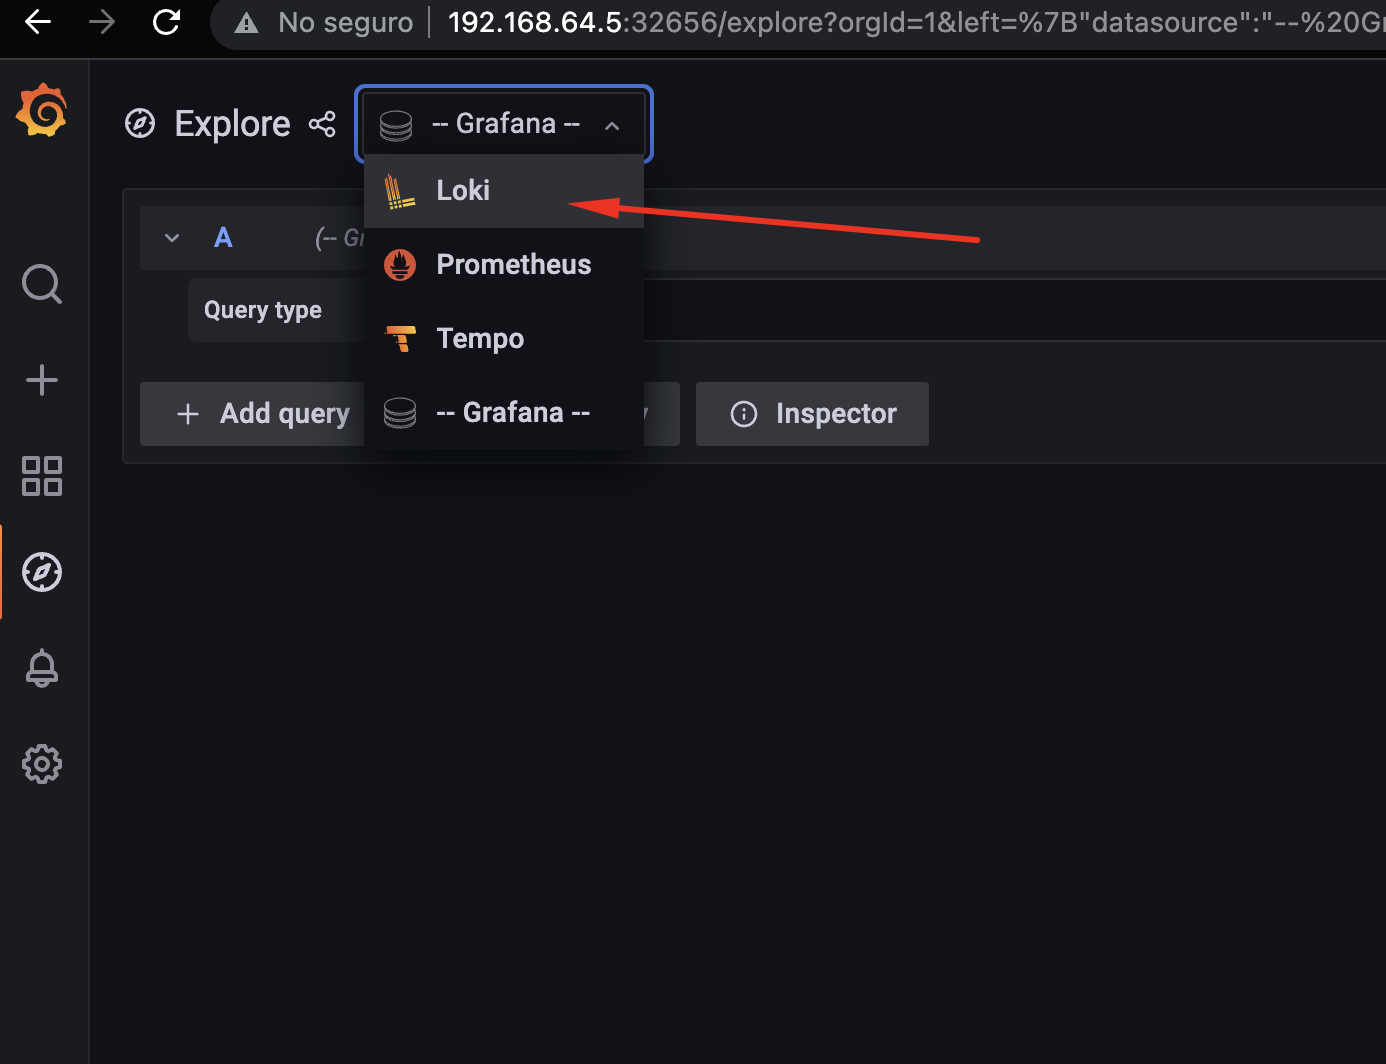
Select Loki as datasource:
With Loki, we can make filters to the Kubernetes resources. We will use the app label of our Spring Boot application. If we have many pods with this label, the logs are centralized.
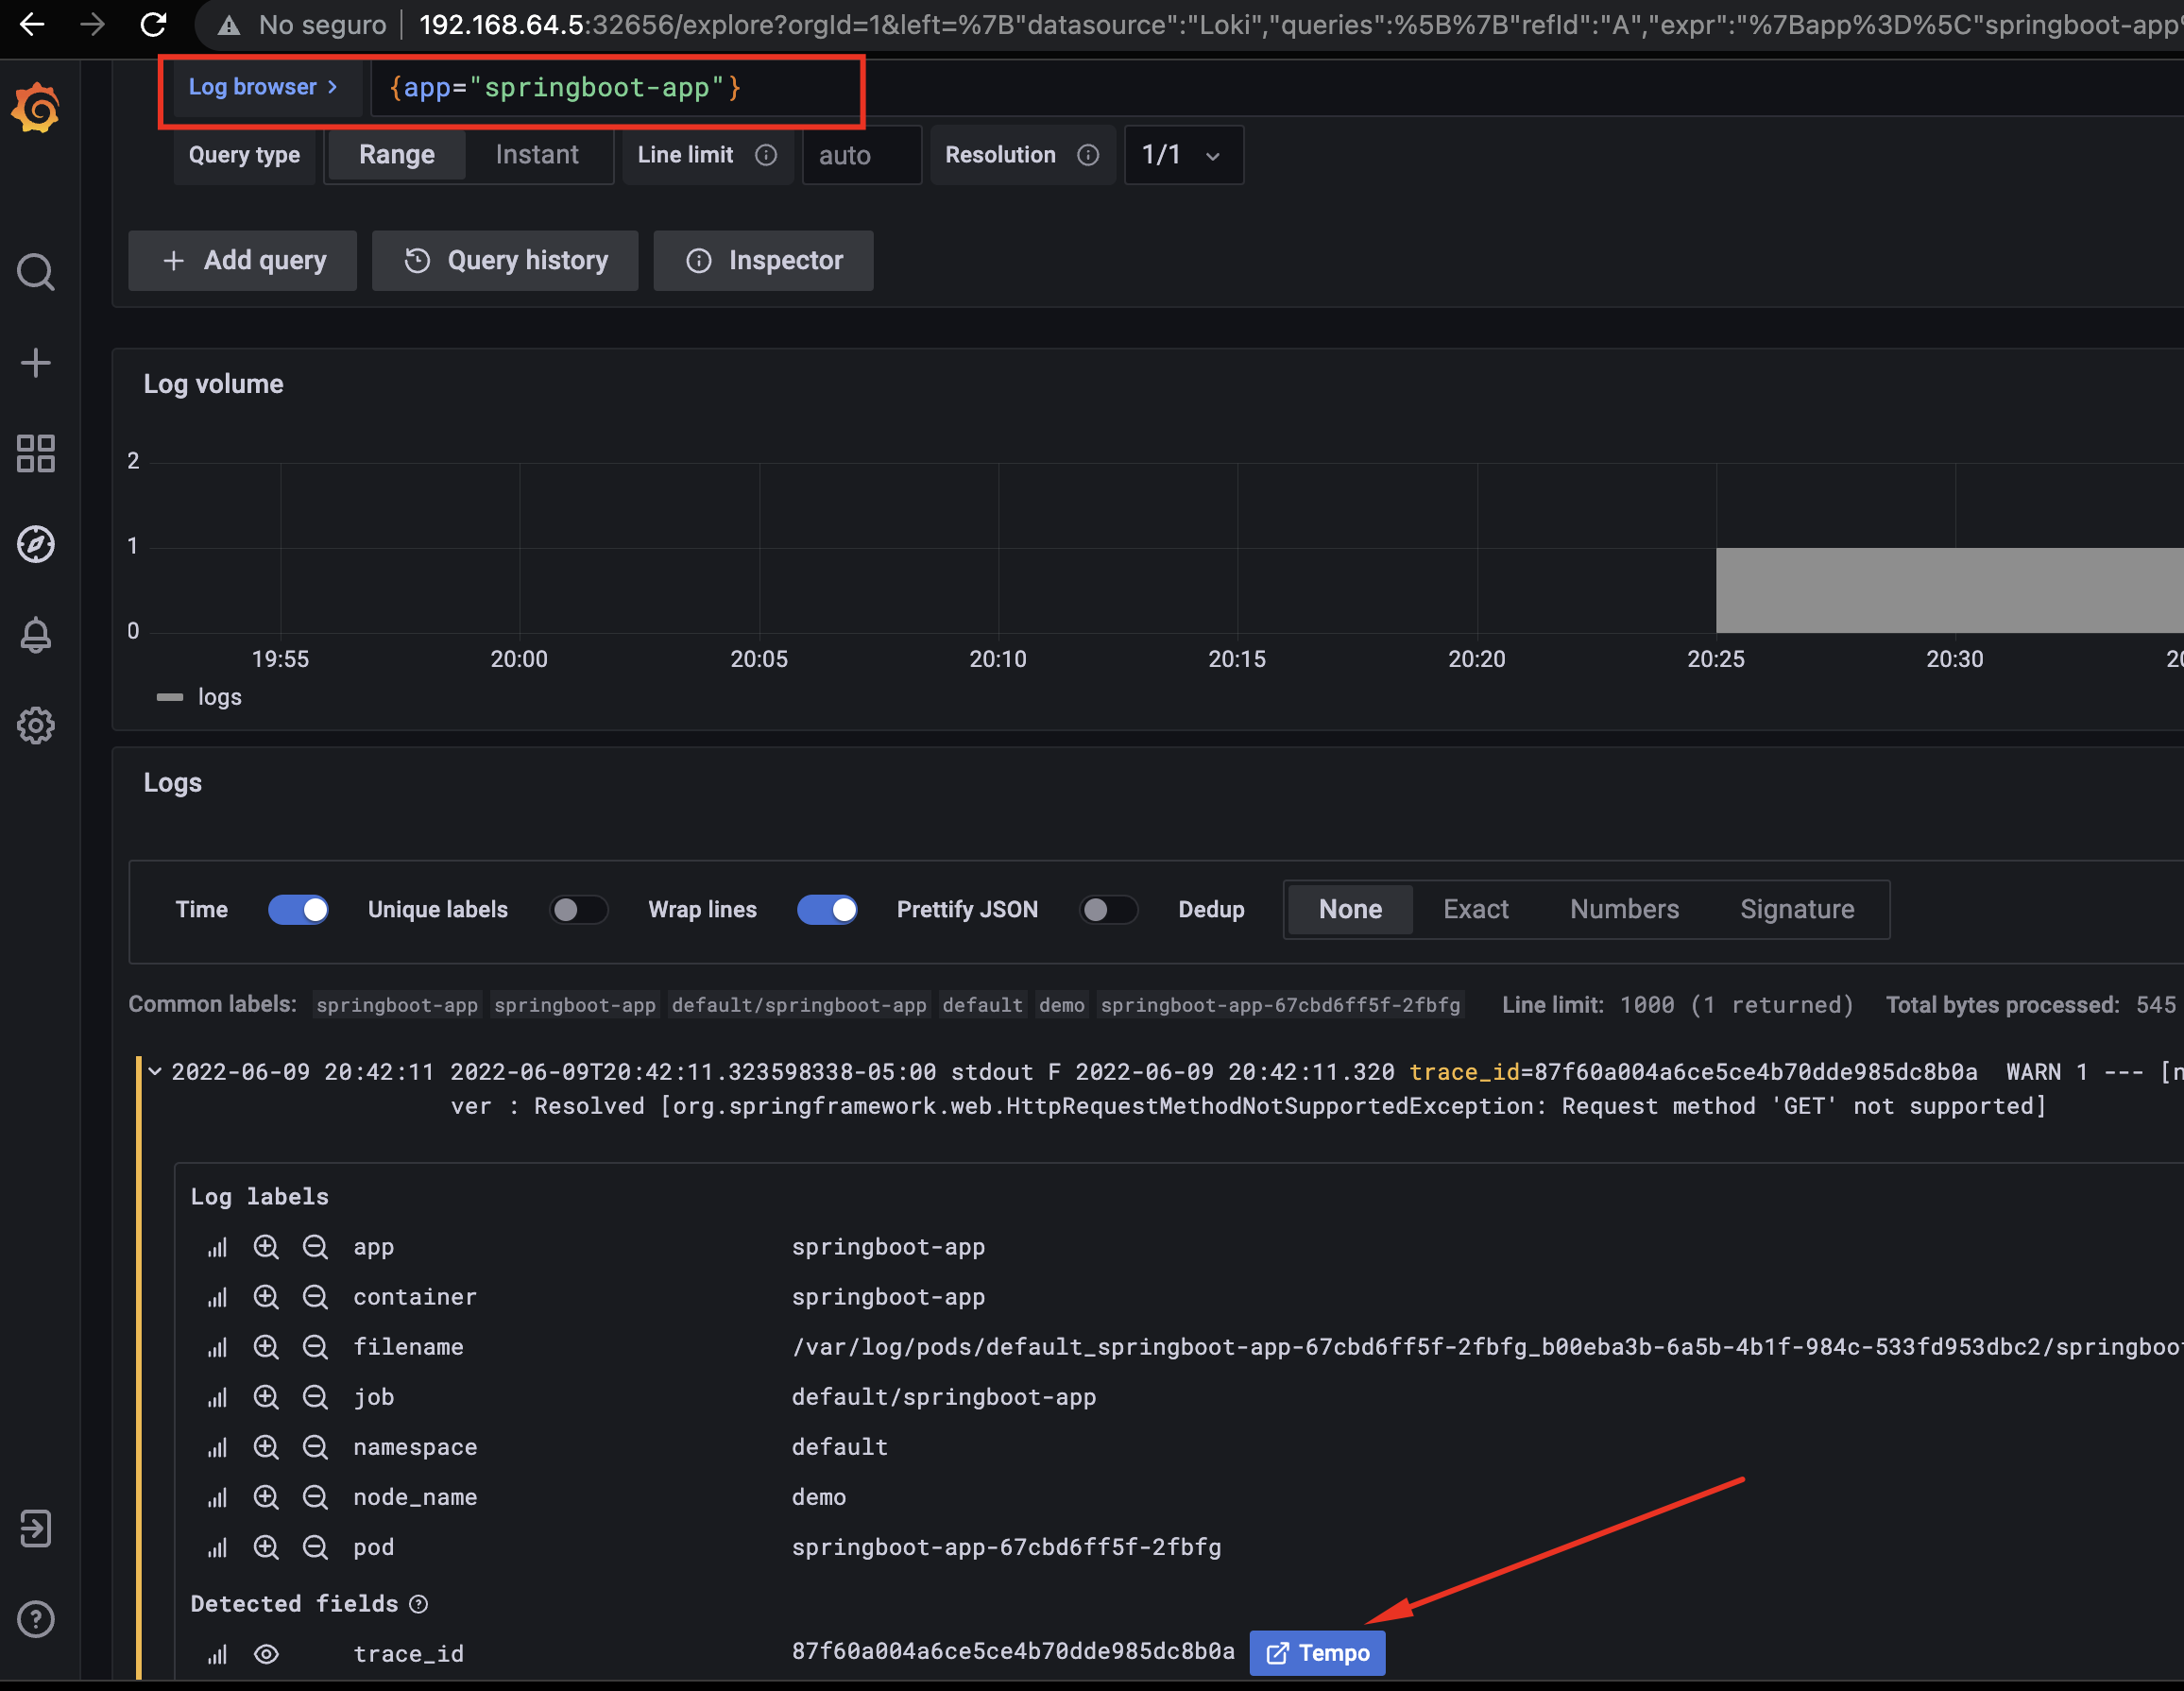
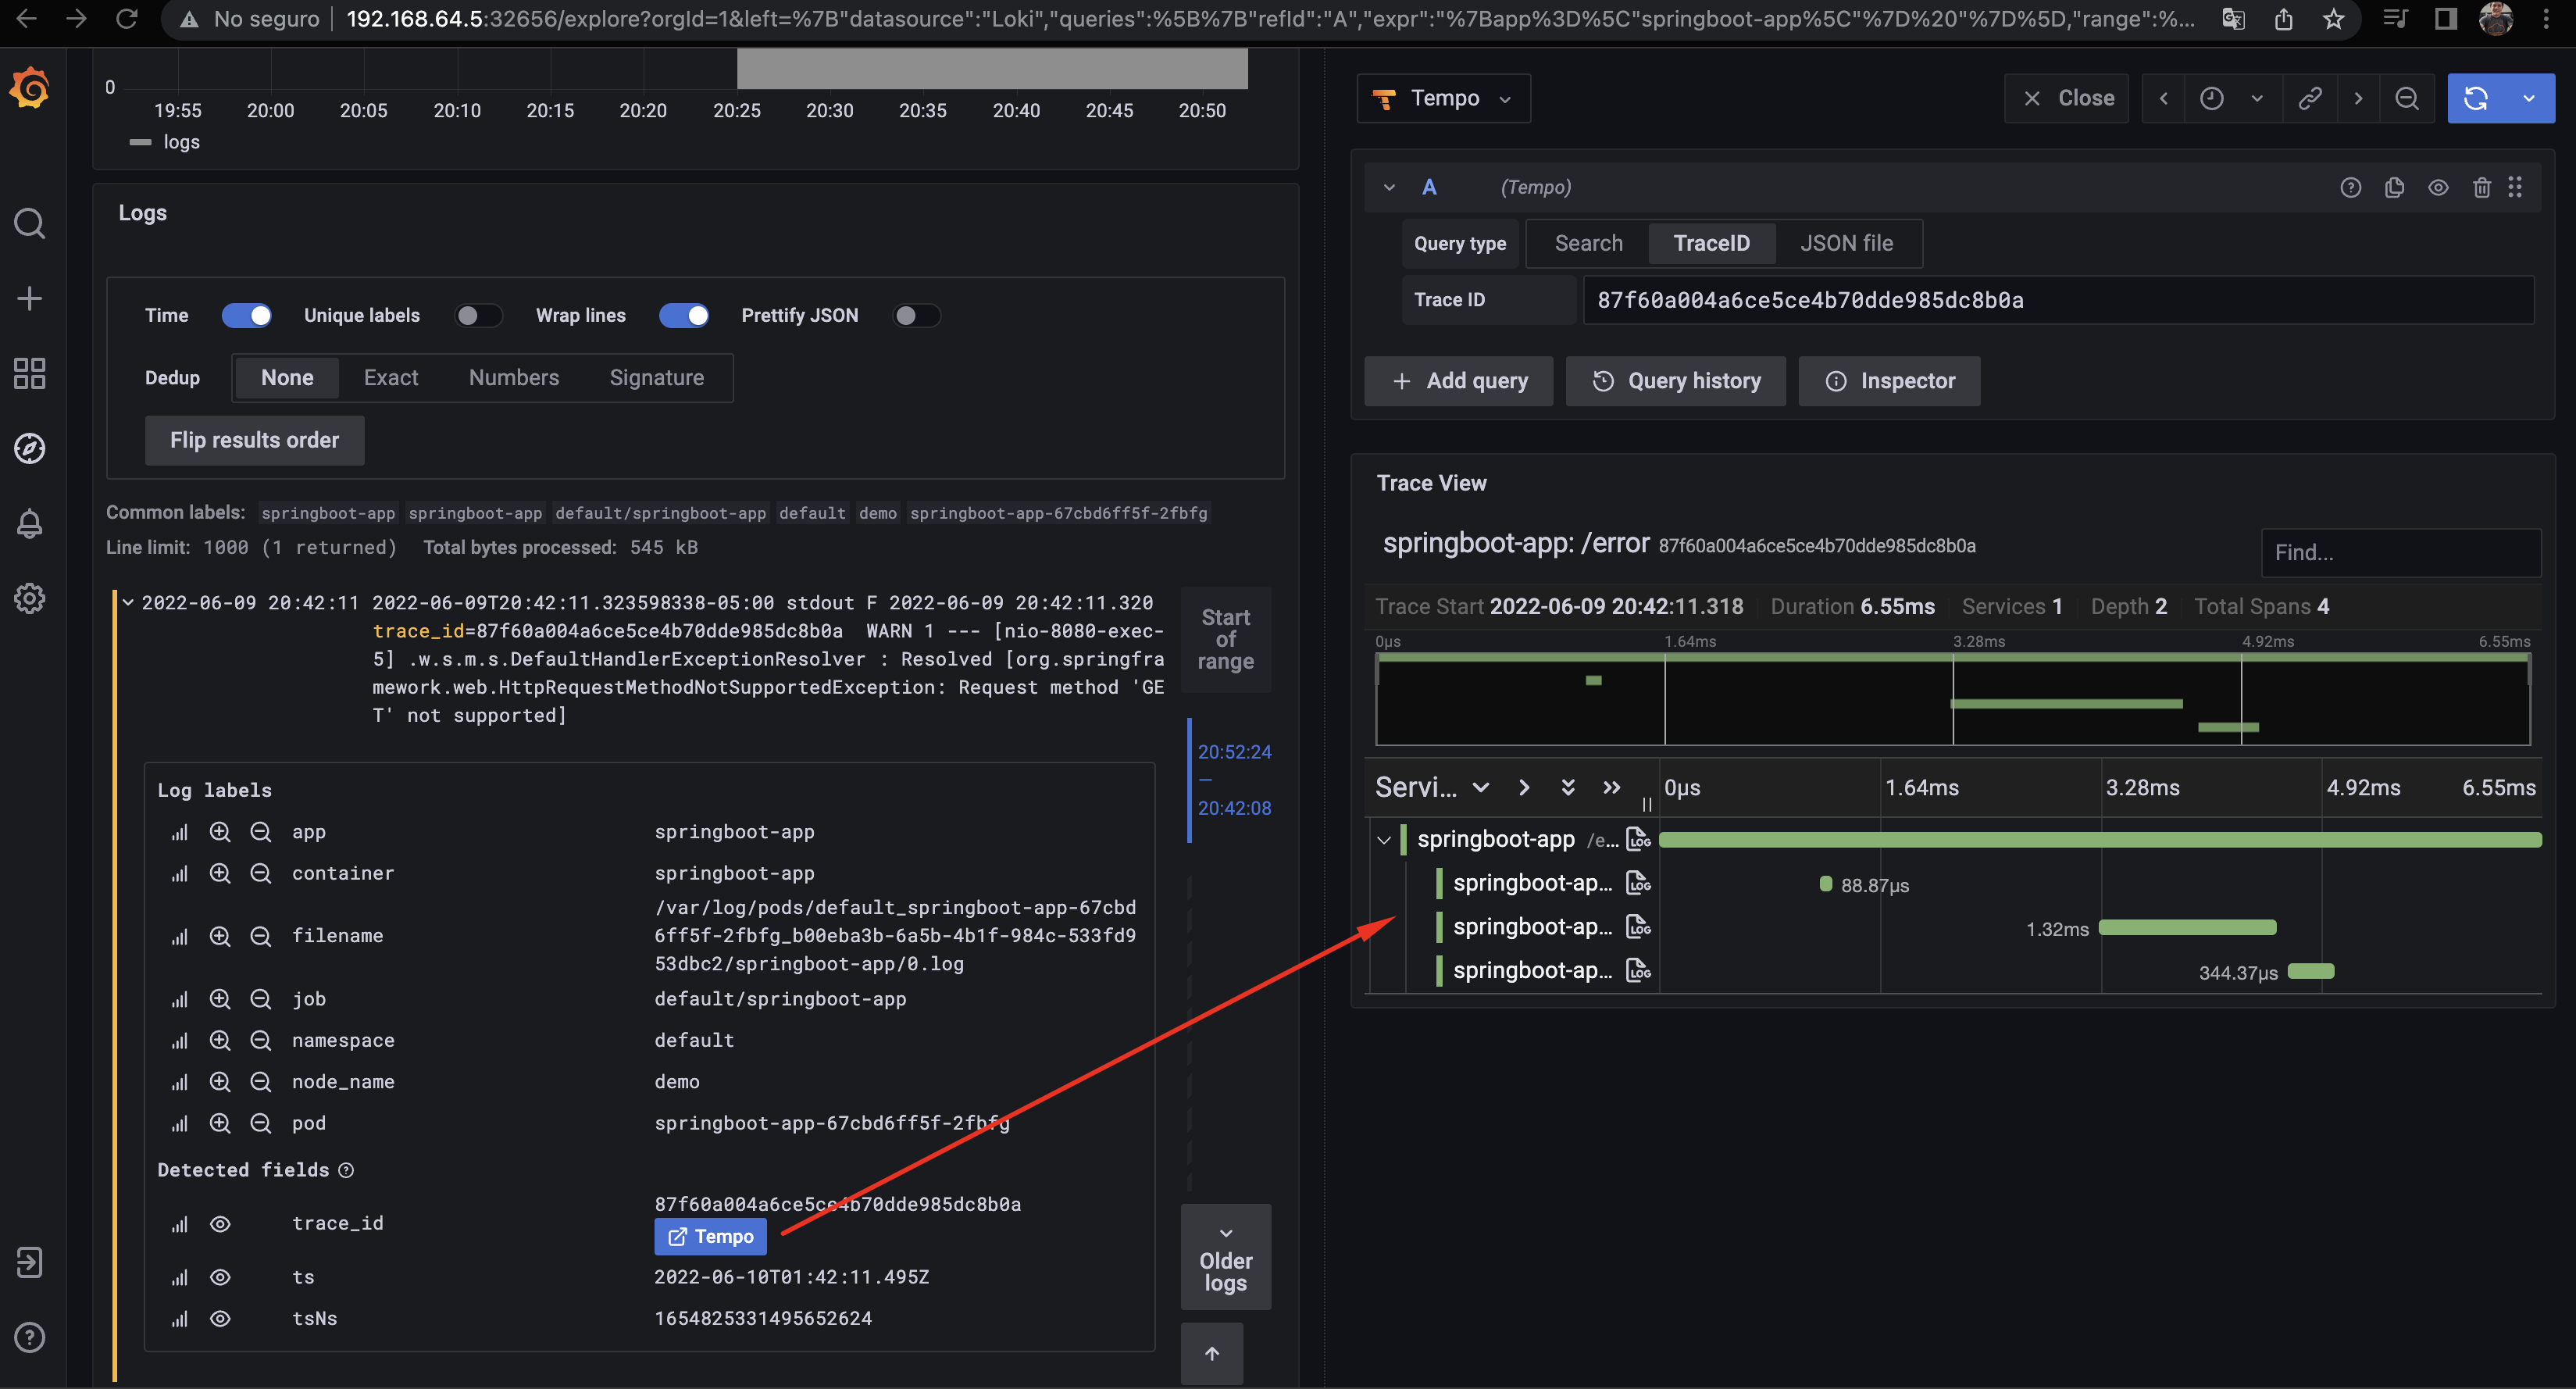
And we see how from the logs we can get to the trace:
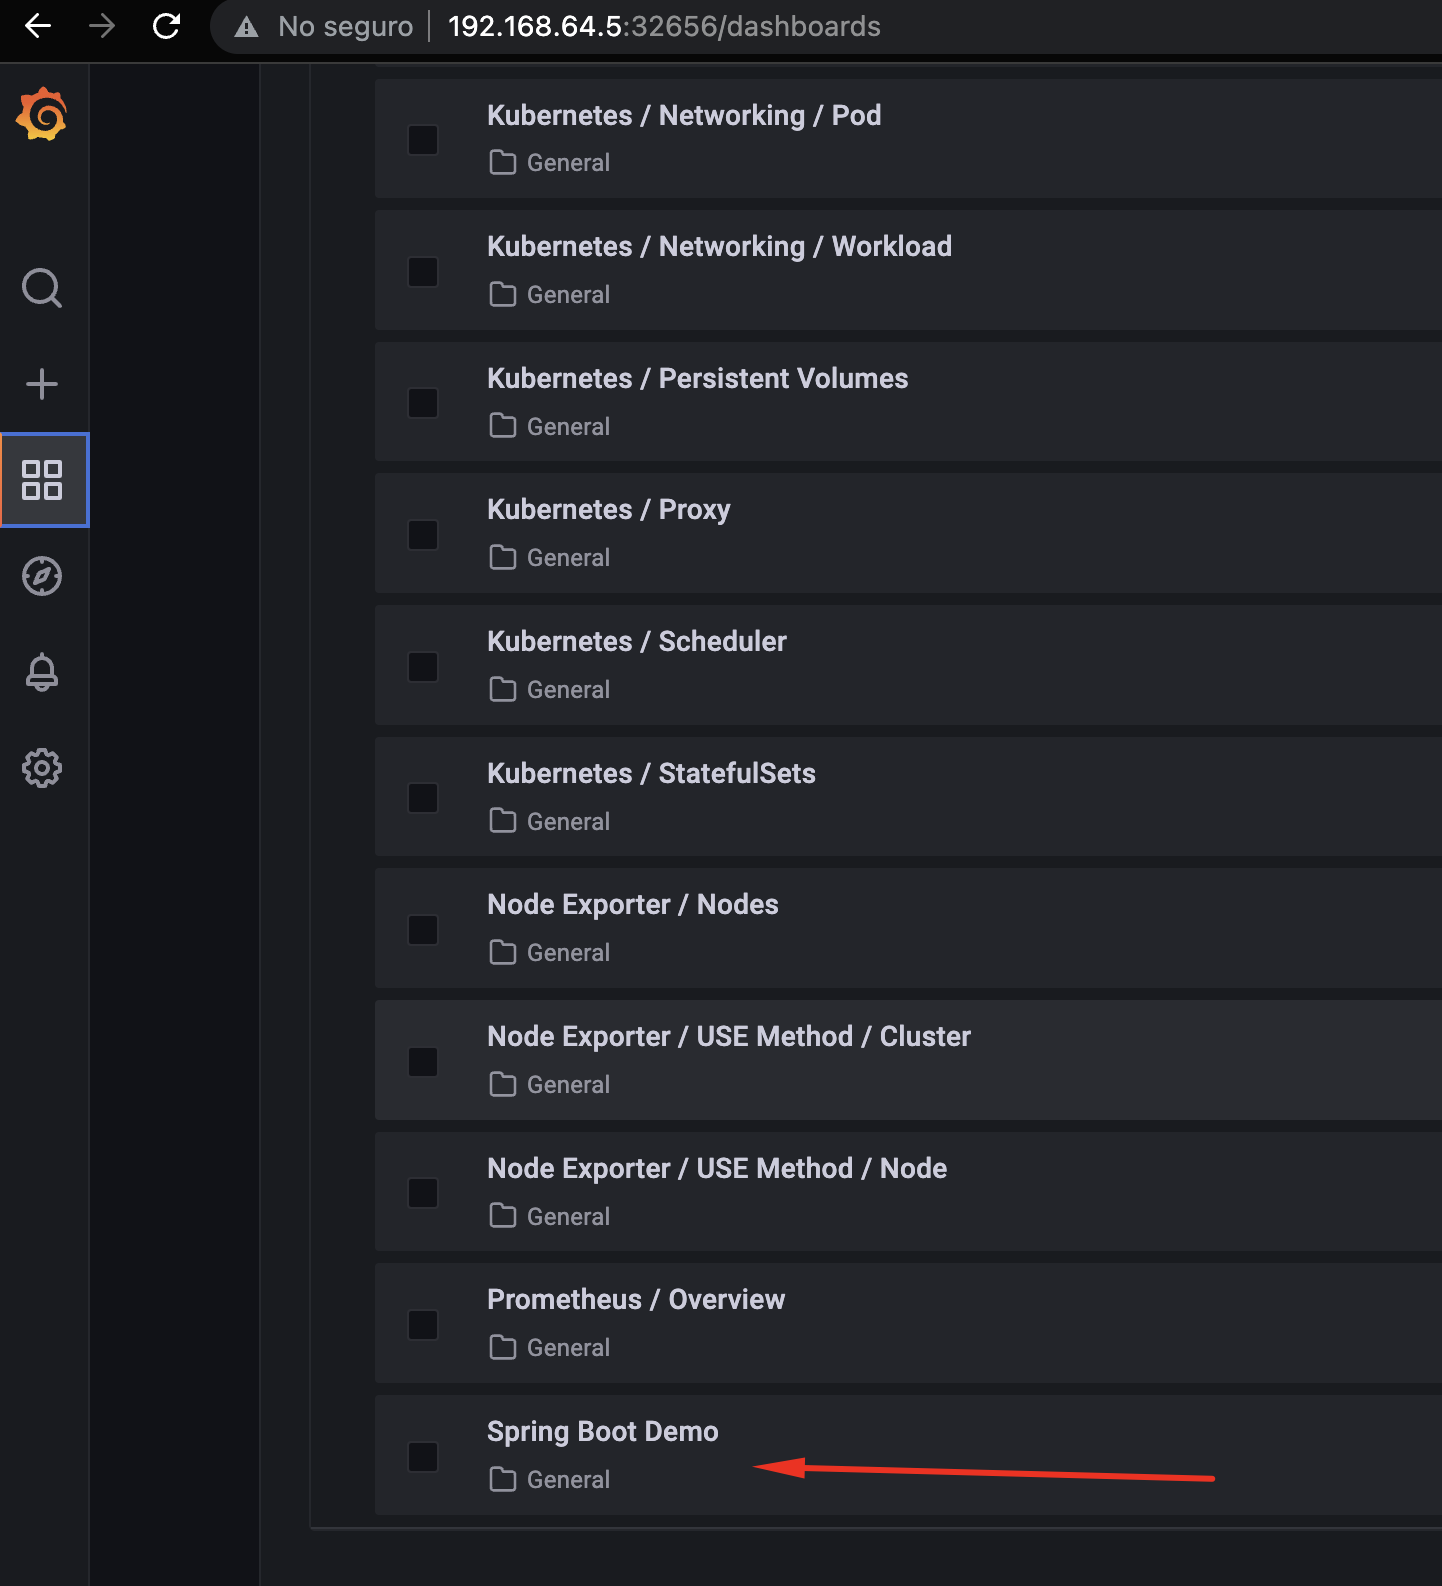
Now let's see our Grafana dashboard:
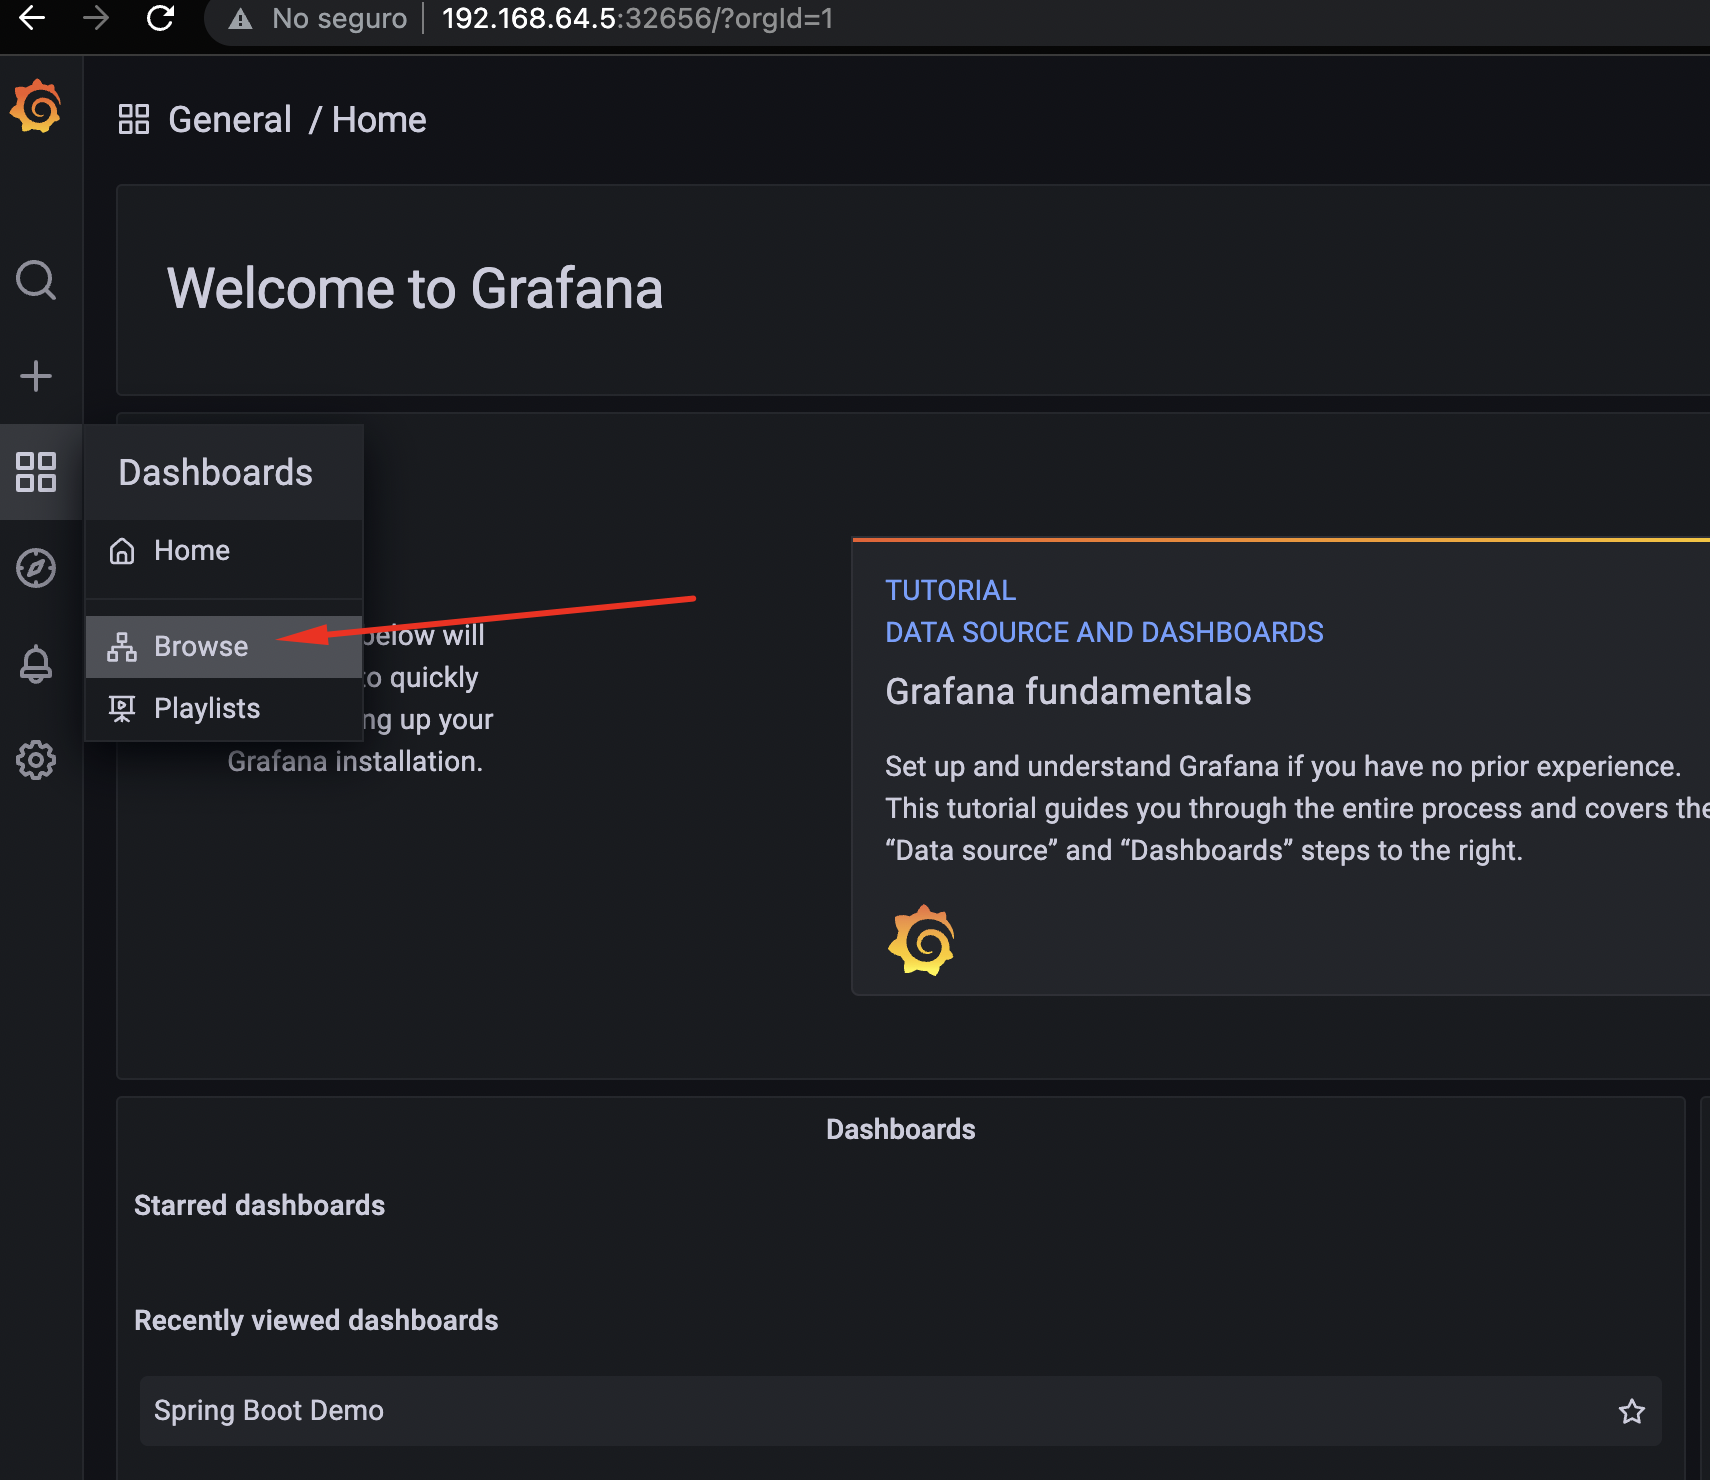
We will see that the last one is Spring Boot Demo, this is the one that we create as ConfigMap at the moment of deploying our Spring Boot application.
This histogram shows Requests Latency, we can see the behavior of our Spring Boot application, we will see some stars, these are generated by Exemplar:
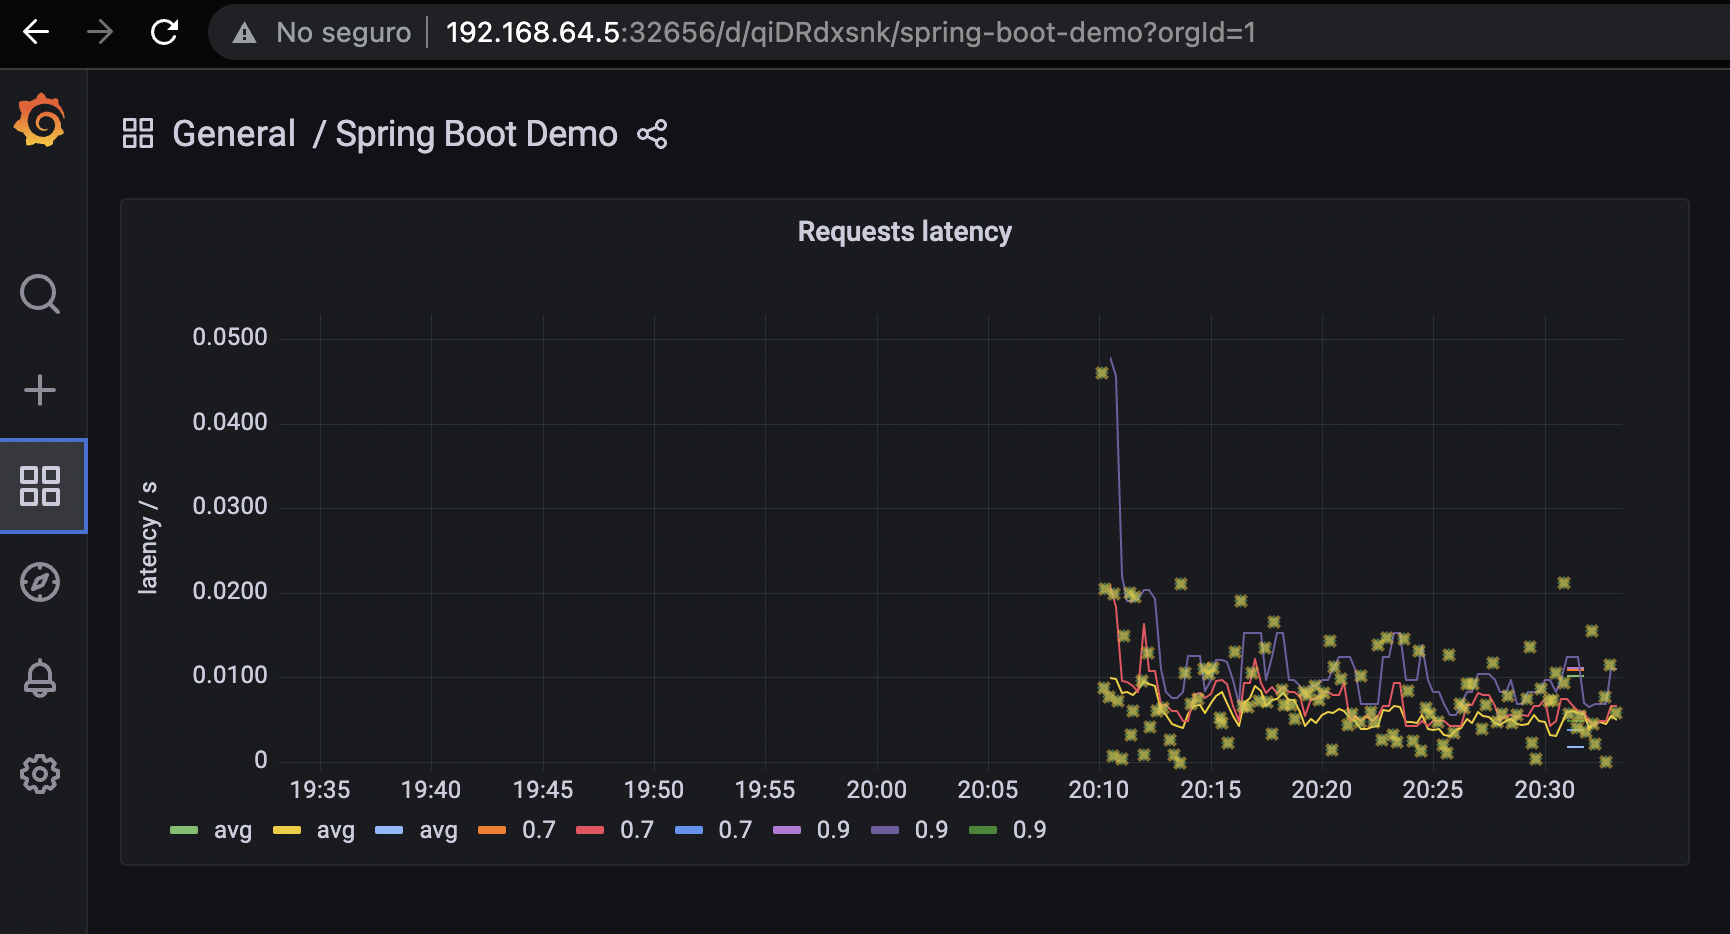
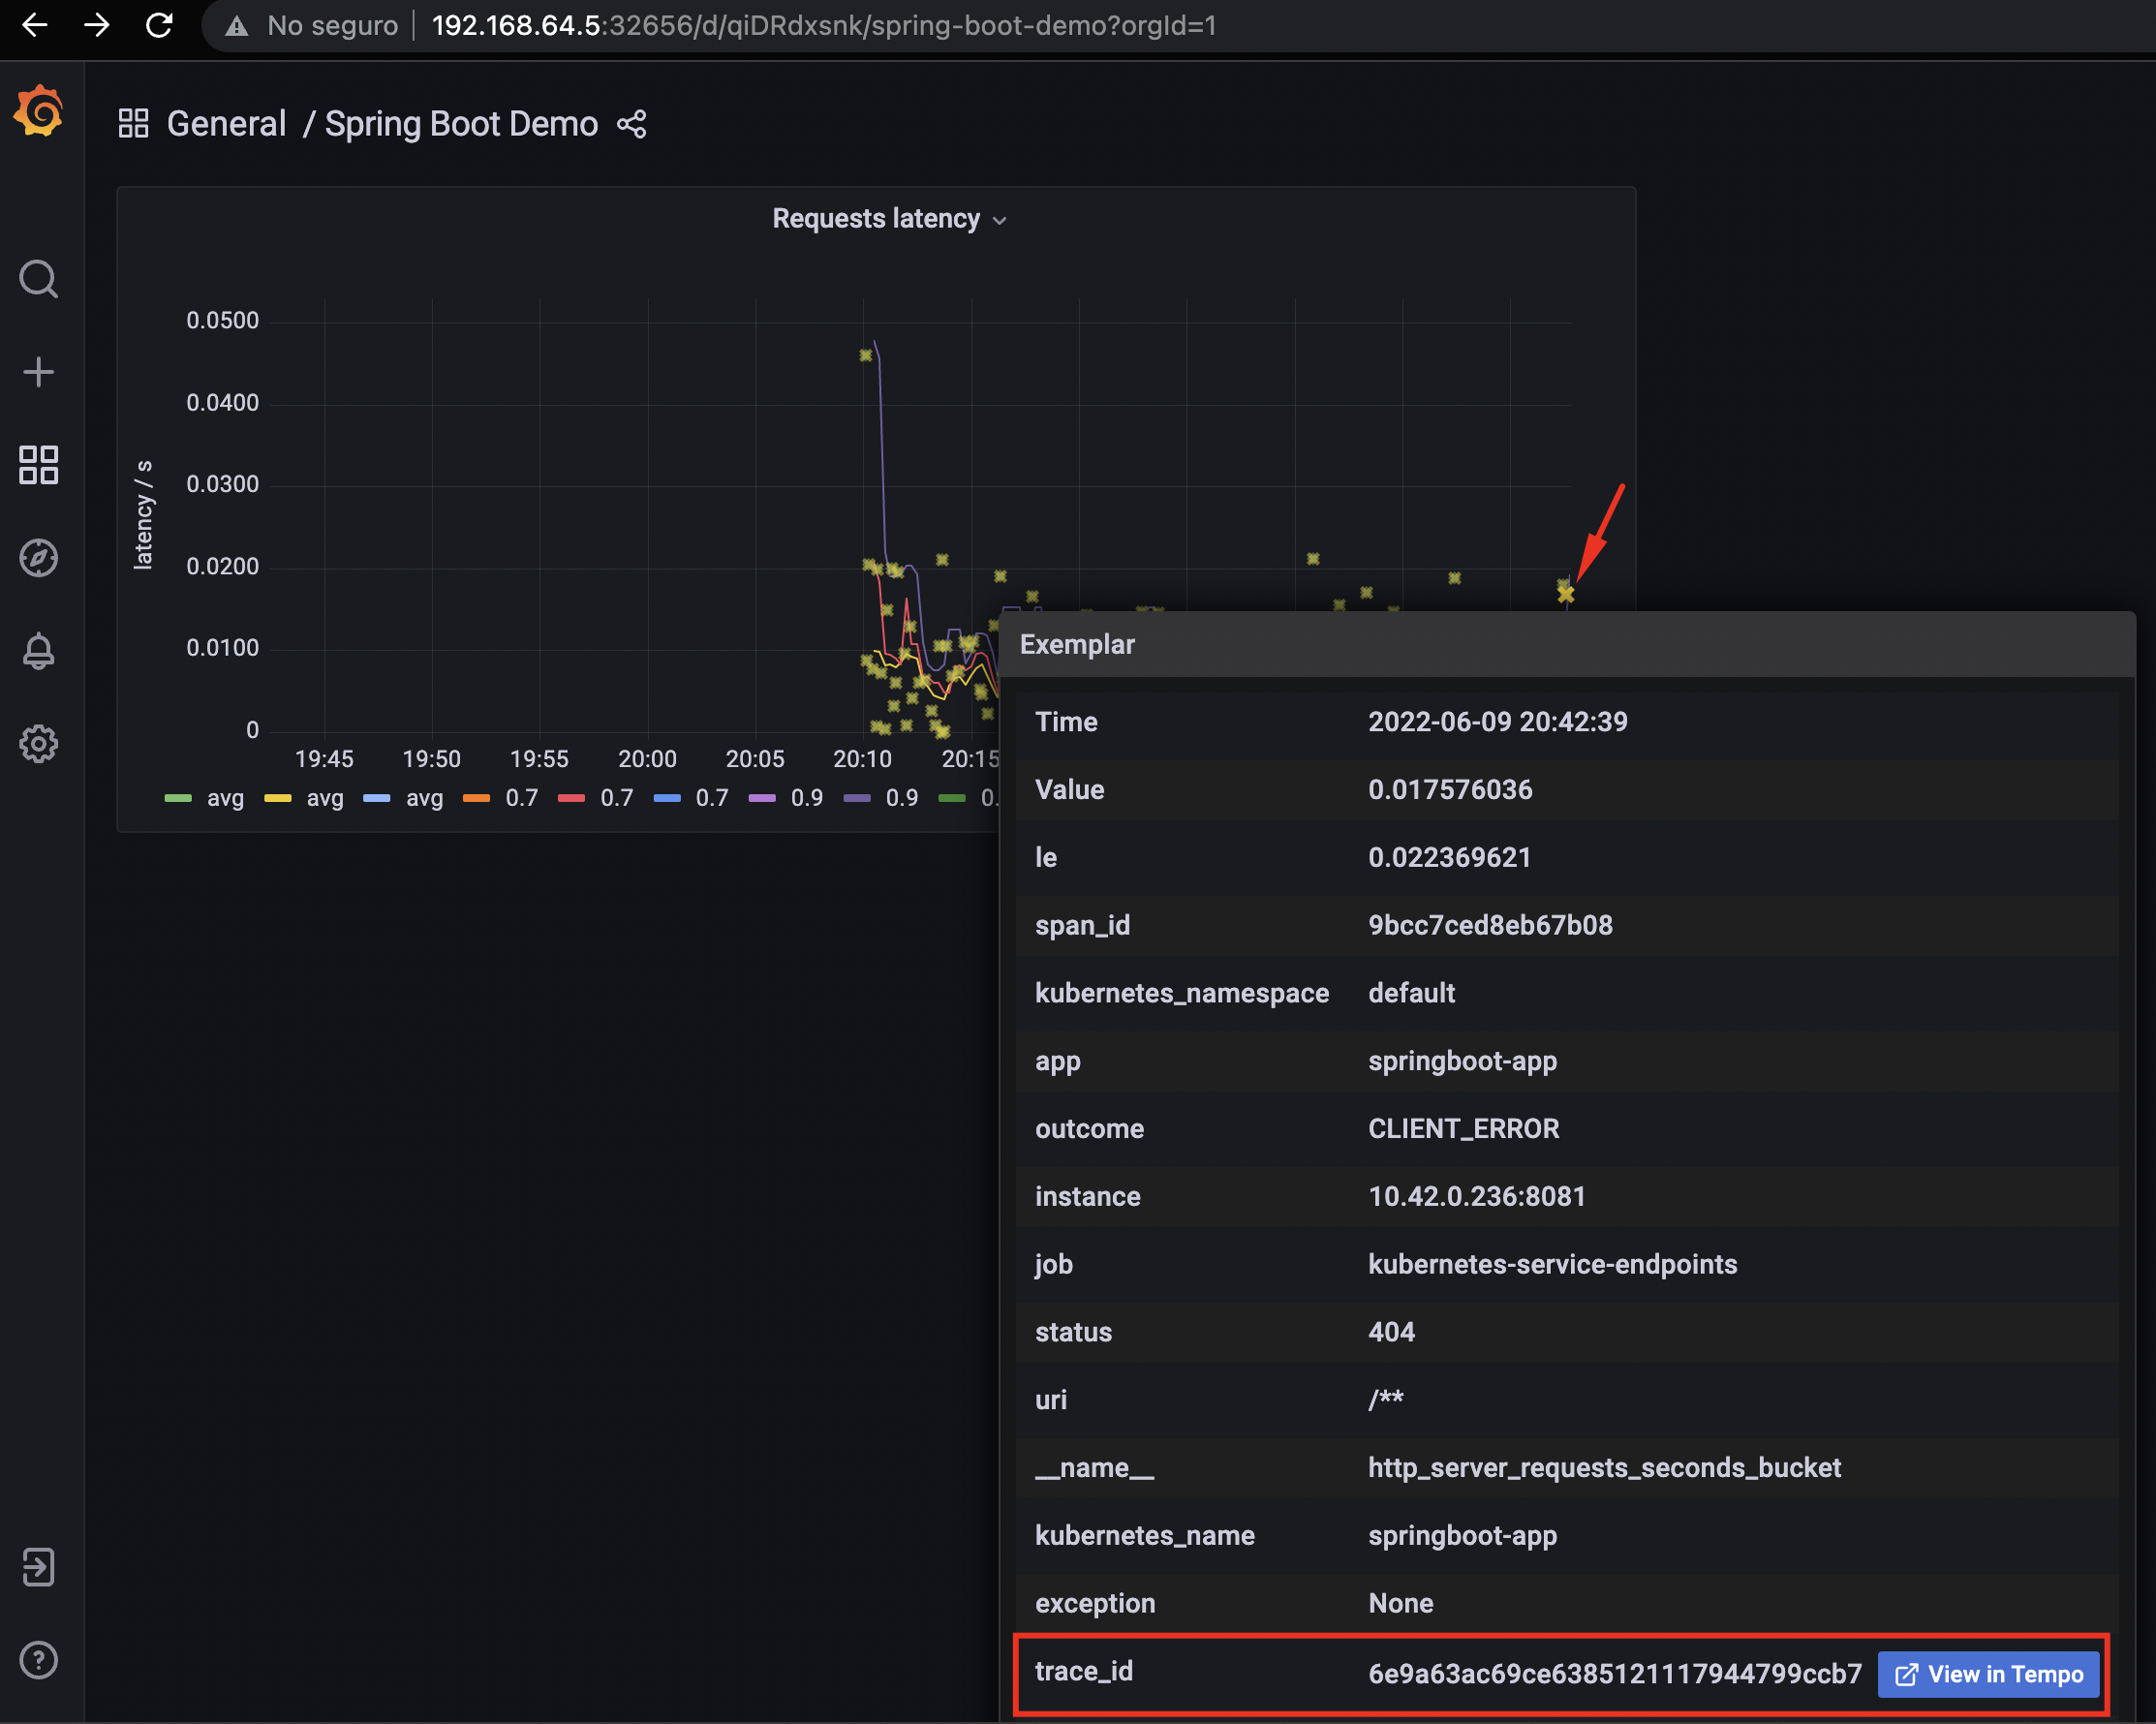
By hovering over it with the mouse, we can see how it is correlated to a trace_id which will then redirect us to Tempo when clicked:
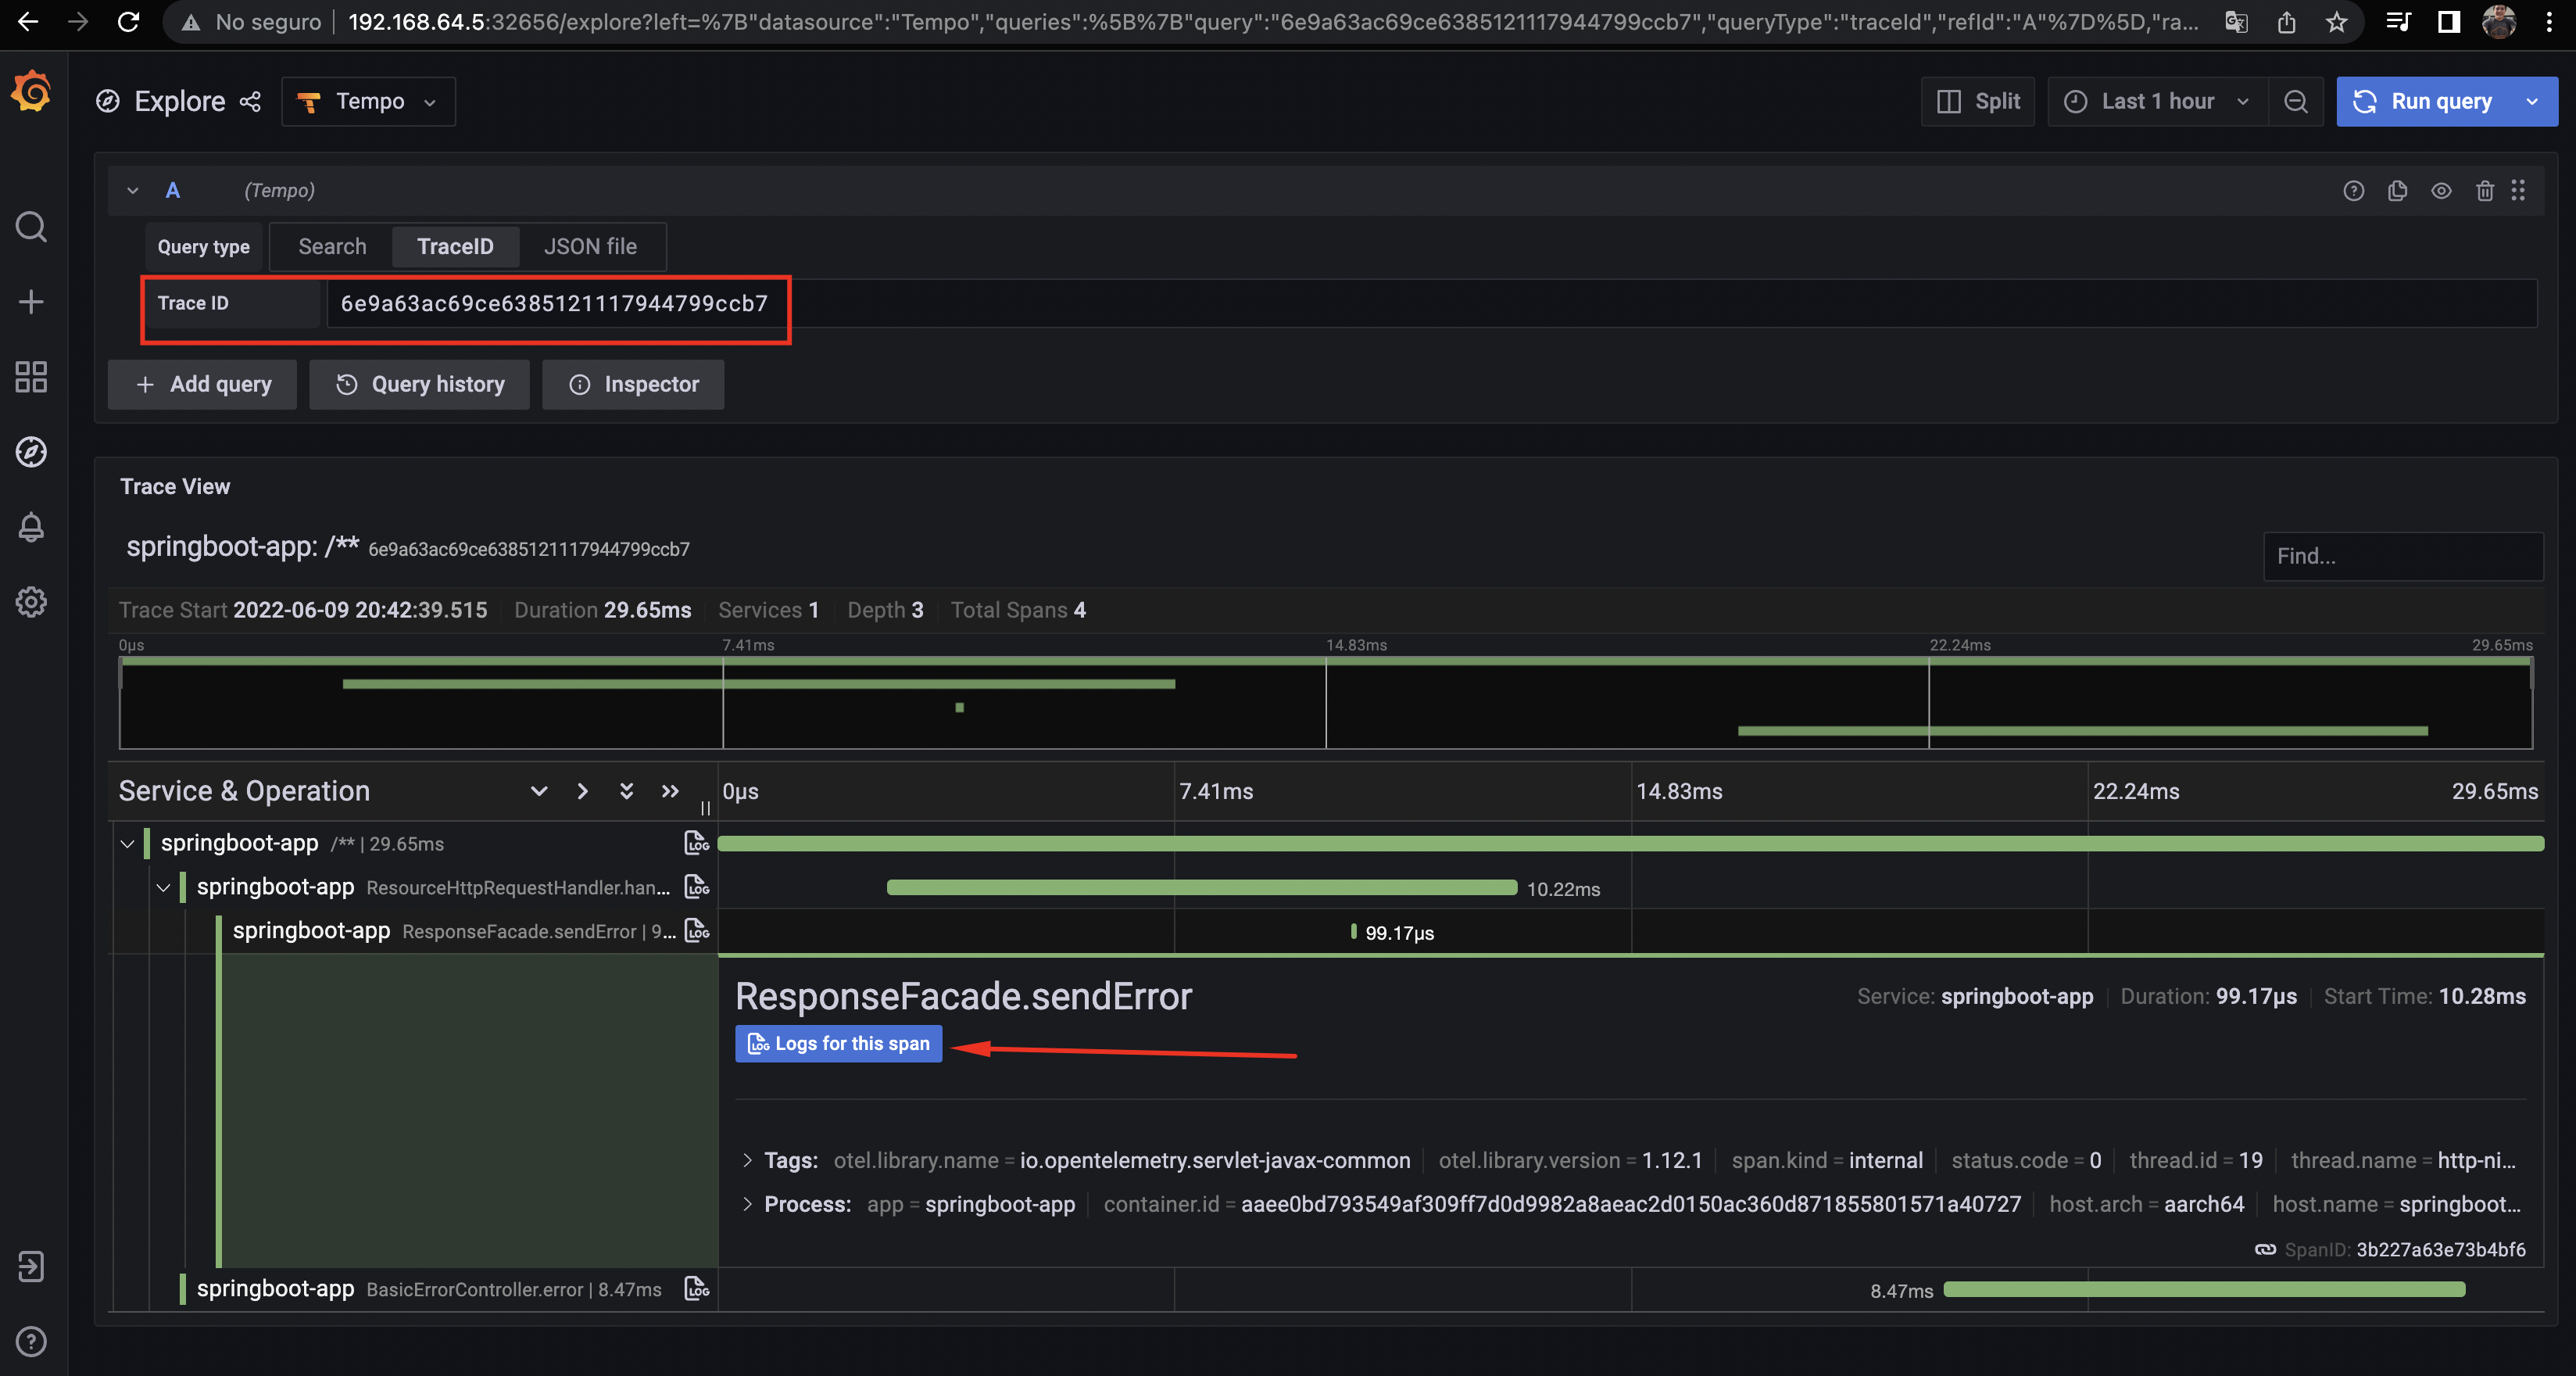
We can see the trace that it generates and we can also see the log, since it is also correlated with Loki, when clicking we will have:
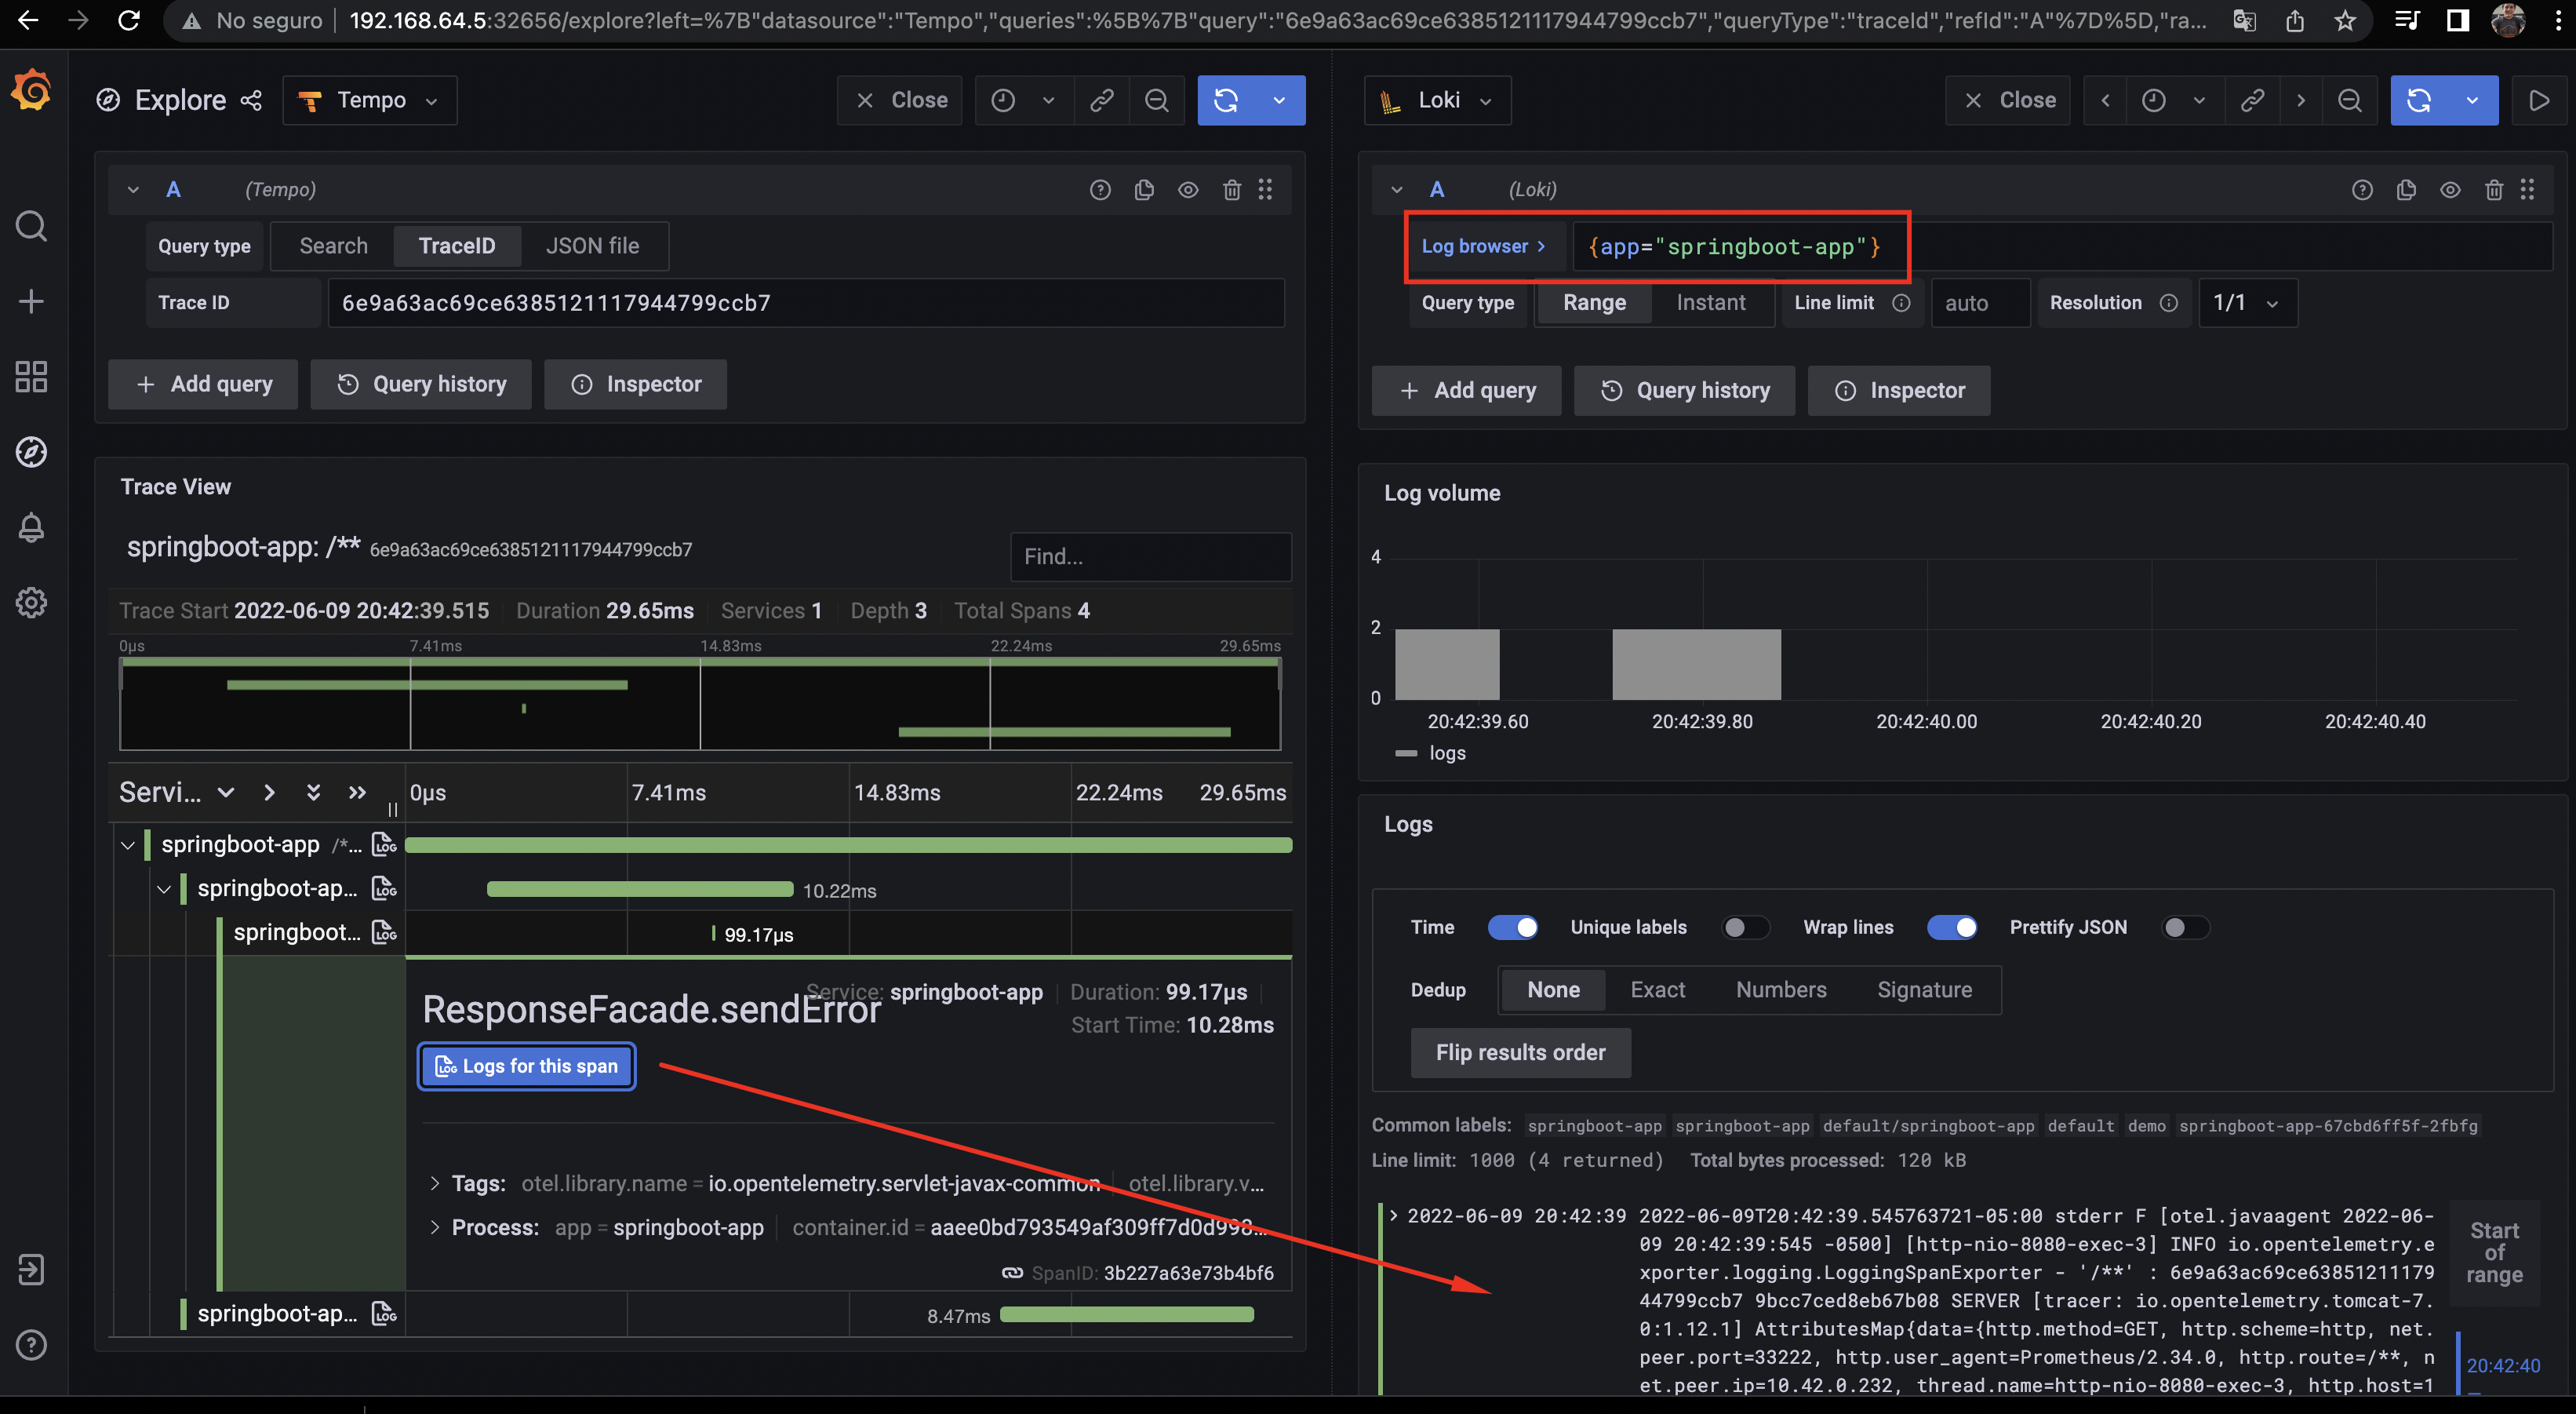
The screen is split and we can see the log it generates.
Finally we have implemented observability correlated between metrics, logs and traces. This can help us in the process of microservices troubleshooting, identify bottlenecks, see the behavior of our application metrics and be able to get to specific traces and logs.
If you made it this far, thank you very much for joining me in this demo. I'm happy to share with you all what I can learn!
Happy coding!